AWS
Cloud Computing Architecture Diagram: Top 8 Enterprise Examples

AI Workspace for Diagrams & Collaboration
Get your team started in minutes
Sign up with your work email for seamless collaboration.
Cloud computing is critical to building great, scalable, secure, and efficient systems. Given the complexity and intricacy of a cloud environment, architecture diagrams are really important for successful deployment and maintenance. The blueprint's visualization needs to guide the team in executing and aligning its cloud strategies.
Here, we will discuss the top 8 cloud computing architecture diagrams, which include a Cloudairy and Cloudchart that transforms the design of cloud architecture for AWS, Azure, and Google Cloud.
They help in the design process by illustrating the proper framework to deploy applications and services into the cloud.
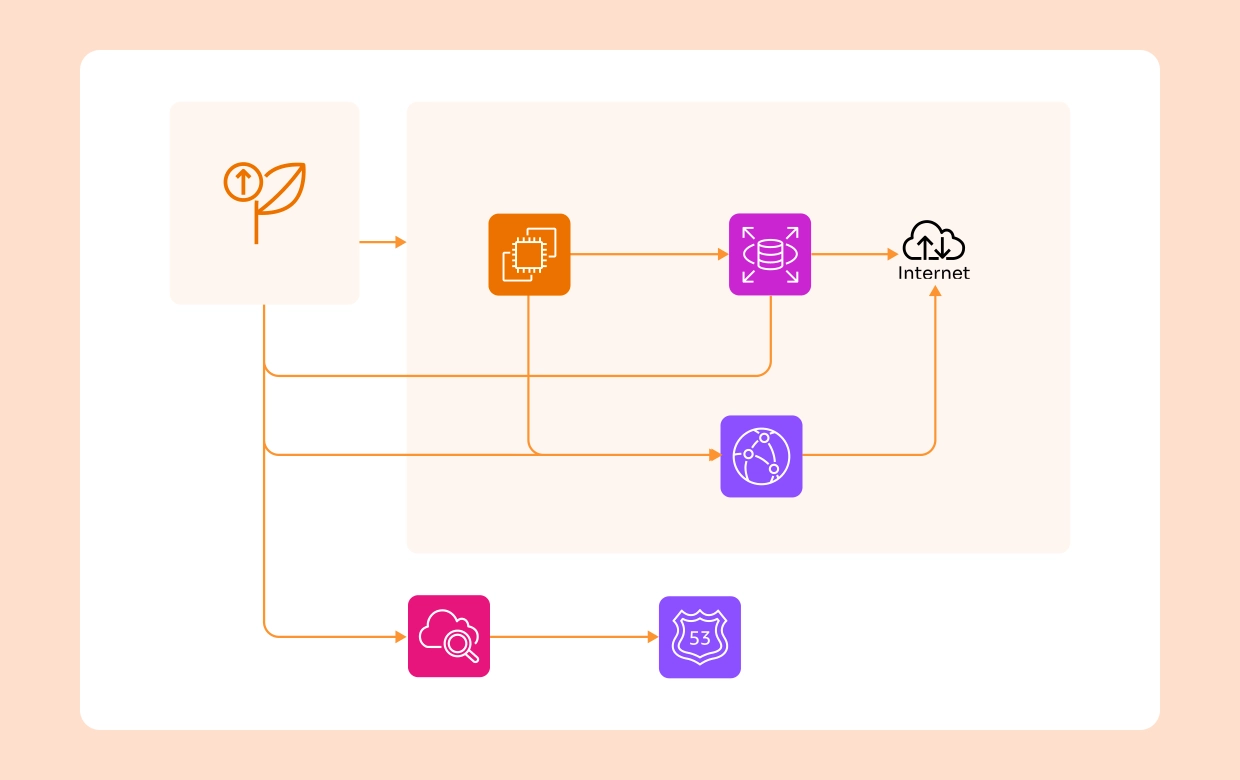
The cloud platform used the most is AWS, and any business that uses some form of cloud service would rely on basic architecture diagrams. Generally, key services in their architectures would include EC2 or Elastic Compute Cloud, S3 or Simple Storage Service, and RDS or Relational Database Service.
AWS architecture diagrams deliver crystal-clear insights into how applications and services are deployed to ensure high availability, scalability, and security. Cloudairy takes AWS diagrams to a further level with features like real-time collaboration by teams on infrastructure designs to optimize cost and performance.
Microsoft Azure offers a comprehensive cloud services platform: Azure architecture diagrams mainly track the most important components, including virtual machines, the Azure SQL database, and the Azure app services. Benefits for enterprises who choose an Azure strategy include hybrid cloud integration with on-premise systems.
Diorms of Azure cloud architecture help visualize complex infrastructures and ensure proper governance across resources. Cloud Chart, with its rich set of Azure-specific templates and design elements, simplifies the creation of detailed architecture diagrams, promising a seamless design process for development and IT teams.
Google Cloud Platform (GCP) thrives on scalability, machine learning, and containerized applications, with its main architecture structured upon tools such as Kubernetes Engine and BigQuery. The architecture diagram of Google Cloud clearly highlights services like Compute Engine, Cloud Functions, and VPC networks.
For a recent business utilizing data analytics or AI-based apps so much, a correctly designed GCP architecture diagram is what determines their success. Organizations can use Cloud Chart to create an interactive diagram that scales for GCP and shows how different cloud resources work together to optimize performance.
Very often, for enterprises that want to align on-premise infrastructure with public cloud services, hybrid cloud architectures are the way to go. A hybrid cloud architecture diagram is a visual combination of private cloud components, on-premises systems, and public cloud services. It shows the various flows of data and workloads between the different components.
Hybrid Clouds Design: Hybrid cloud solutions provide the best of both worlds. They ensure the data security of sensitive workloads while securing the scalability of public clouds. Cloudairy will help simplify complicated diagrams, which will help business entities map out easy data flows and ensure that public and private clouds continue working in harmony.
Many modern organizations strive not to get vendor locked by adopting a multi-cloud strategy, which is a combination of services from multiple cloud providers, such as AWS, Azure, and Google Cloud. A multi cloud architecture diagram is an illustration of where the different platforms interact so that all workloads are distributed for best performance, security, and economy of scale.
In Cloudchart, you can produce multi-cloud diagrams to illustrate how disparate cloud providers might be integrated together, so you can show data flow continuity, and make failover and disaster recovery plans better.
Microservices is an extremely popular approach to creating cloud-native applications in which every service is an independent entity and interacts over APIs. The microservices architecture diagram breaks up what is otherwise an unnecessarily complex application into smaller, manageable services that might be developed, deployed, and scaled independently. If your cloud applications run in containers, you can also explore how a Kubernetes architecture diagram explains cluster components, pods, and networking in modern cloud environments.
Microservices architectures support agility, scalability, and rapid development cycles. Using a collaborative design platform by Cloudairy allows teams to design and govern their microservices architecture diagrams with utmost optimization for component deployment in the cloud.
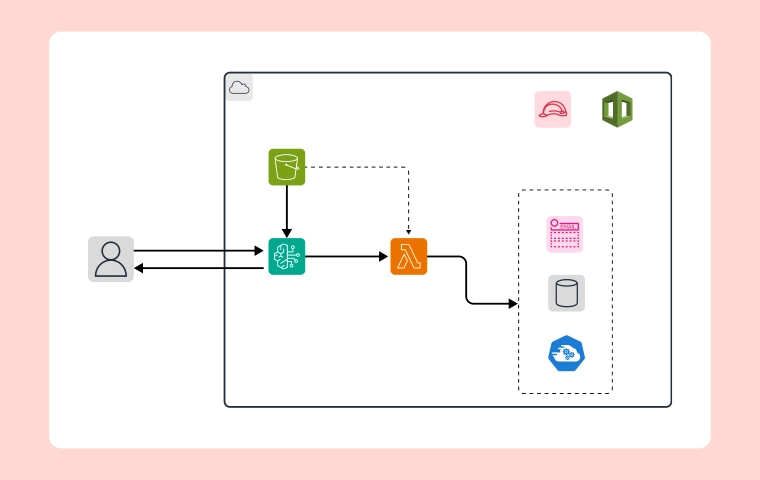
On the other hand, serverless computing allows enterprises to develop and deploy applications without the burden of server management. In a serverless architecture diagram, AWS Lambda, Azure Functions, or Google Cloud Functions are all combined along with their triggers, as well as event-driven components.
Serverless architecture is apt for businesses that aim to make the operations less complicated but also automatically scale up or down according to the demand for services. Cloud Chart enables architects to design and visualize serverless infrastructures, meaning such event-driven systems can work flawlessly with zero management over the infrastructure.
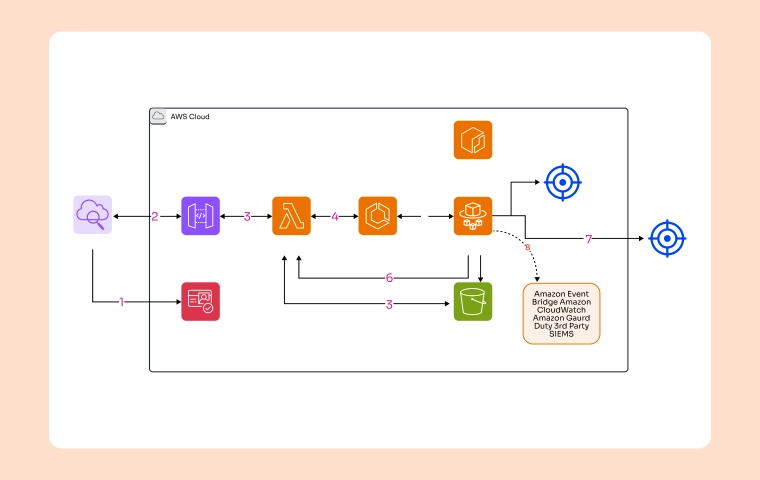
For today's businesses, continuity of business needs to be ensured, especially in the case of system failure or outages. A diagram that portrays a disaster recovery (DR) cloud architecture is an overall configuration of backup systems and failover procedures accompanied by data recovery points across cloud infrastructure.
A well-illustrated disaster recovery diagram helps bring downtime to nil and ensure quick recovery in case of a failure because the systems can quickly be resumed. Cloudairy provides designing DR architecture diagrams that show where backups will occur, step-by-step recovery, and redundancy setting up arrangements so that unpreparedness by way of an unexpected disruption would not find enterprises off guard.
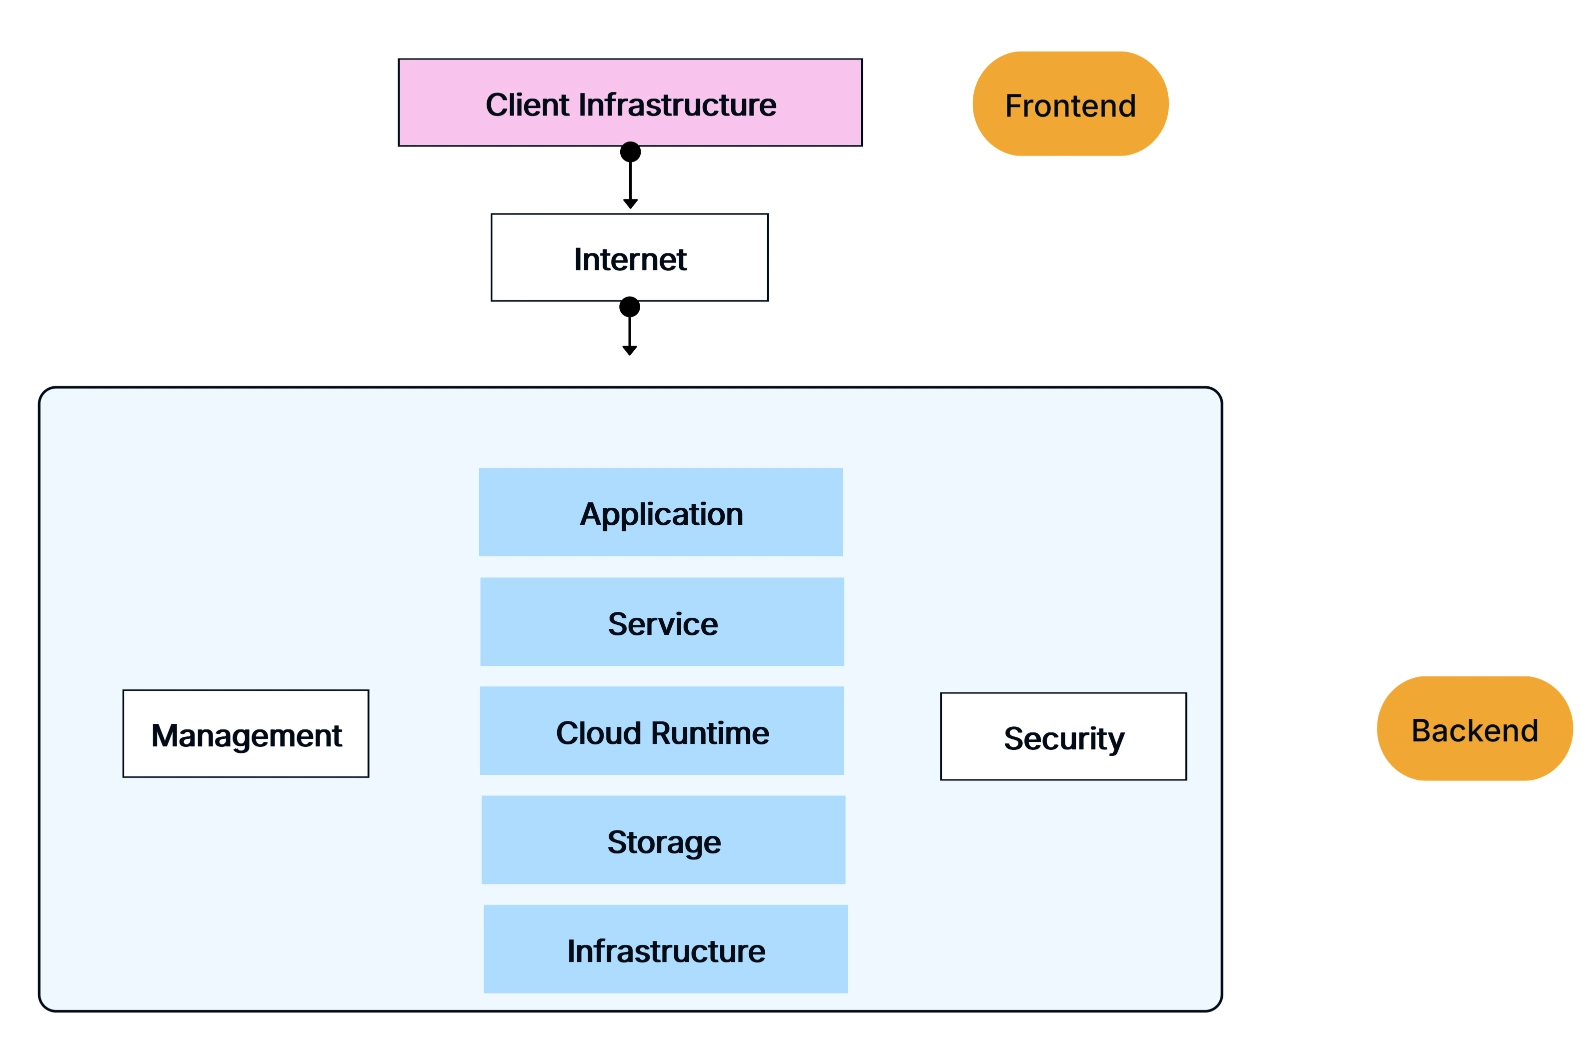
A well-designed cloud computing architecture diagram should clearly represent infrastructure, services, and data flow. Keeping diagrams simple and structured helps teams quickly understand system design and deployment strategies. To understand how large-scale systems are structured, see how a software architecture diagram helps optimize system design and infrastructure planning.
a. Use a Clear Structure:
Organize the diagram into logical layers such as application, database, and infrastructure. This improves readability and helps teams understand how components interact.
b. Focus on Key Components:
Avoid overcrowding diagrams with too many elements. Highlight essential services such as compute resources, storage, networking, and security layers.
c. Show Data Flow and Security:
A cloud computing architecture diagram should illustrate how data moves between services. Including security components like firewalls and access control helps ensure safe system design.
Many organizations follow common design patterns when building cloud systems. These patterns help create reliable and scalable environments and are often represented through a cloud computing architecture diagram.
1. Three-Tier Architecture
This pattern separates applications into presentation, application, and database layers. It improves scalability and simplifies system management.
Many modern applications are delivered through SaaS platforms, and a SaaS architecture diagram helps visualize how cloud services support scalable software delivery.
2. Microservices Architecture
Microservices break applications into smaller services that communicate through APIs. A cloud computing architecture diagram helps visualize how these independent services interact.
3. Event-Driven Architecture
Event-driven systems process actions such as user requests or data updates through messaging systems and serverless services, enabling flexible and scalable cloud applications.
Many industries are looking for a better way to run their operations through the adoption of cloud computing. However, this transition is characterized by specific challenges that must be solved to ensure that cloud-based settings provide efficient, scalable, and secure environments for services. Diagrams of cloud computing architectures can prove fundamental in identifying and solving such related issues as offering a clear visual presentation of the cloud infrastructure in question. However, cost management, security of data, and infrastructure complexity are some common cloud related problems that many organisations face. Here are some common cloud computing problems faced by industries along with how architecture diagrams can help in overcoming these problems.
Problem Statement:
The flexibility and scalability offered by cloud services make them pricey if not managed appropriately. Many businesses experience high costs due to inefficient resource distribution and use, improper service utilization, and underutilised infrastructure.
The Solution:
This cloud architecture diagram will allow organizations to identify services used and areas of redundancy or underutilization. Businesses can now picture the cloud resource usage and make decisions to appropriately consolidate or downsize their cloud structure for removal of unnecessary expenditures.
For instance, cost optimization diagrams represent regions that entail cost savings and exhibit usage behaviours. Cloud diagram cost management features allow organizations to keep track of their real-time cloud expenses, thereby enabling time adjustments and enhanced cost controls.
The Solution:
Diagrams of the architecture of the cloud depict how data is shared in the cloud to make it easier to visualize where necessary security has to be enforced. Such diagrams can point to places of locations for firewalling and encryption protocols, as well as to control access to data with regard to maintaining that data flow securely and in line with regulations.
Diagrams can detail data access points and even show how encryption is used, thereby aiding the organisations in their ability to ascertain whether their cloud infrastructure is in keeping with the industrial compliance standards and security policies.
Problem Statement:
Scaling cloud infrastructure in response to varying demand is extremely difficult, particularly for businesses that fluctuate significantly during peak loads. The businesses that are not careful in planning for it usually suffer from downtime or slow performance in most cases.
The Solution
Cloud architecture diagrams can help teams determine which portions of the infrastructure they need to scale and how. Establishing details around load balancers, auto-scaling groups, and flexible cloud services ensures that systems scale without interruption while growing demand is matched.
With these diagrams, the organization gets ready to scale dynamically to scale up the infrastructure so that it does not impact performance and cause downtime. With this, businesses will ensure continuity in service even with higher demands.
Problem Statement:
Most organisations use more than one cloud provider, such as AWS, Azure, and GCP, or have on-premises infrastructure along with cloud resources. Multi-cloud and hybrid clouds create different levels of complexity involving the transfer of data, service integration, and resource management.
The Solution:
The cloud architecture diagrams represent the topology of multi-cloud and hybrid cloud environments in terms of how different services and systems interact with each other. Diagrams make the integration easier because they clearly show the direction of data flow between on-premise systems and cloud providers.
Diagrams and data flow visualisation and integration points are, therefore, helping organisations across the globe reduce complexity and improve operational efficiency across diverse cloud environments, which makes management easier and reduces the risk of service disruptions.
Problem Statement:
Organizations which are involved in mission-critical operations do have to shrink their downtime, and also, they should be equipped with considerable disaster recovery. But in the background of such a transparent cloud infrastructure, lack of transparency in the cloud infrastructure can point out the critical weaknesses from which prolonged outages might emerge.
The Solution:
Indeed, disaster recovery architecture diagrams provide the blue print to failover strategies to make sure that appropriate redundancy and backup configurations are in place. Disaster recovery architecture diagrams mainly elucidate backup locations, redundant systems, and disaster recovery protocols so that quick recovery can be performed immediately after an outage.
Diagrams enable organisations to build resilience into their infrastructure: Identify single points of failure and model disaster recovery processes. This tests recovery protocols and helps ensure business can be restored rapidly in the case of an outage and, consequently, minimise downtime.
Creating a clear Multi Cloud Architecture Diagram becomes much easier with the right diagramming platform. Cloudairy provides a powerful cloud architecture diagram generator with a visual workspace where teams can design, organize, and manage cloud infrastructure diagrams efficiently.
.webp)
Cloudairy offers ready-to-use templates and cloud components that help teams quickly build professional cloud computing architecture diagrams for platforms like AWS, Azure, and Google Cloud.
With Cloudairy, teams can collaborate in real time while designing diagrams. Developers, architects, and stakeholders can review and update cloud architecture together, ensuring better communication and faster decision-making.
Cloudairy also allows users to customize diagrams and export them in multiple formats. This makes it easy to share cloud infrastructure designs across teams and documentation systems.
Nowadays diagrams of cloud computing architecture have become one of the very essential tools for most of the enterprises operating in the modern complex world of cloud infrastructure. Platforms like Cloudairy and Cloudchart simplify the design of and the act of visualising highly available, scalable, secure, and cost-efficient cloud environments. They can address such common challenges as well: resource allocation, multi-cloud integration, and disaster recovery, obtaining clear, actionable insights to construct robust systems in the cloud.
By using the architectural design capabilities of Cloudairy and advanced features such as generative AI-powered flowchart generation, 3D visualisation, real-time collaboration, and options for customization, it can make the process of creating cloud ideas much smoother for businesses. These tools allow for better teamwork and creativity with 500+ templates and export options to ensure smooth designing processes for teams in any industry.
1. What is a cloud computing architecture diagram?
2. Why is a cloud computing architecture diagram important?
3. What are the common types of cloud computing architecture diagrams?
4. How do cloud architecture diagrams improve system scalability?
5. Which tool can be used to create cloud computing architecture diagrams?
Start using Cloudairy to design diagrams, documents, and workflows instantly. Harness AI to brainstorm, plan, and build—all in one platform.
Table of Contents

Introduction
 Manage all your work in one placeCollaborate with your teamUse Cloudairy for FREE—forever


 Related Articles