DevOps
Elevating Observability with Prometheus and Telemetry Data Platforms

AI Workspace for Diagrams & Collaboration
Get your team started in minutes
Sign up with your work email for seamless collaboration.
Complex programs and networks require observability to be understood and supported through insights into system health and performance. This blog looks at how Prometheus and telemetry data platforms add to this insight for comprehensive opinions, quick troubleshooting, complete view and effective alerts leading to optimized management of systems.
You can also explore our ready to use Template on Cloudairy to create, customize, and visualize your market analysis effortlessly.
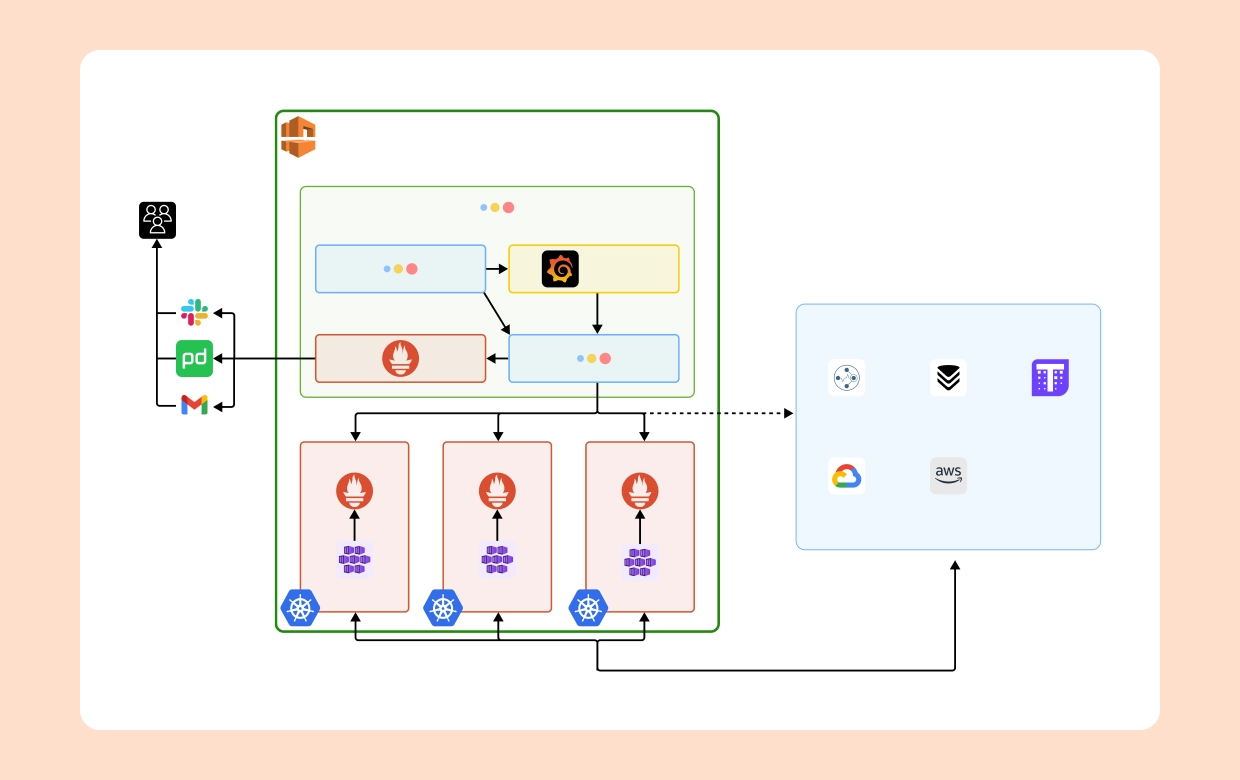
Prometheus is an open-source monitoring system that excels in collecting valuable metrics from various components of applications or infrastructure. It offers a robust set of features, including:
By combining the strengths of Prometheus and TDP, organizations can unlock a new level of observability, enabling them to make better-informed decisions and ensure the smooth operation of their systems. Here's how this integration can benefit your observability strategy:
Comprehensive Insights:
Holistic View: The combination of Prometheus and TDP offers a holistic view of system health and performance, providing a deeper understanding of the infrastructure and its components. This comprehensive view helps identify interdependencies, spot potential issues, and optimize overall system efficiency.
Data Correlation: Correlating metrics, logs, and traces allows for a comprehensive analysis of system behaviour, enabling organizations to identify trends, anomalies, and performance bottlenecks effectively. By connecting the dots between different data sources, teams can gain a more complete picture of the system state and behaviour.
Faster Troubleshooting:
Root Cause Analysis: By correlating data from Prometheus and TDP, organizations can quickly pinpoint the root cause of issues, facilitating faster troubleshooting and resolution. The ability to quickly identify the source of problems reduces mean time to resolution (MTTR), minimizing the impact of incidents on end-users and the business.
Minimized Downtime: Rapid identification and resolution of issues help minimize downtime, ensuring optimal system performance and user experience. By proactively detecting and addressing problems before they escalate, organizations can maintain the high availability and reliability of their systems.
Holistic Understanding:
System Interactions: TDP can reveal intricate system interactions and dependencies, providing valuable insights into how different components interact and impact overall system performance. This understanding helps teams make informed decisions about system architecture, resource allocation, and capacity planning.
.webp)
Informed Decision-Making: A holistic understanding of system behaviour empowers organizations to make informed decisions about resource allocation, capacity planning, and performance optimization. By leveraging data-driven insights, teams can proactively address potential issues, optimize resource utilization, and ensure that systems are aligned with business objectives.
Efficient Alerting:
Intelligent Alerting: Leveraging correlated data from Prometheus and TDP
enables organizations to set up intelligent alerting mechanisms based on predefined thresholds and anomaly detection, minimizing false positives and ensuring timely incident response. By reducing alert noise and focusing on critical issues, teams can respond more effectively to incidents and maintain system reliability.
Incident Management: Efficient alerting helps teams stay on top of critical issues, enabling proactive incident management and resolution to maintain system reliability and availability. By quickly identifying and addressing problems, organizations can minimize the impact of incidents on end-users and the business, ensuring a positive customer experience.
In summary, merging Prometheus with Telemetry Data Platforms is a valuable technique to boost observability across complicated software systems and infrastructure. This facilitates better performance, informed decision-making, automation, and prevention of disruptions, among other operational efficiencies as required by modern IT setups- all made possible through the holistic comprehension, rapid troubleshooting and extensive alerting associated with such an integration. Therefore, given that observability remains paramount for any organization, combining these two tools presents an adaptable and scalable means of attaining insights into complex environments while maintaining operational excellence.
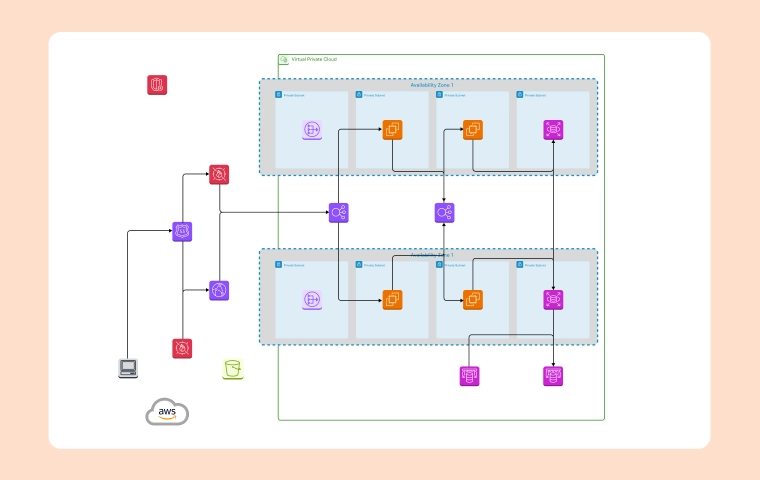
Cloudairy Cloudchart simplifies the design process for observability architectures that include Prometheus and telemetry data platforms. It offers features like real-time collaboration for brainstorming and making changes on the fly. Pre-built templates provide a starting point to design your system efficiently. With customizable shapes, annotations, and diagramming tools, you can clearly illustrate components, interactions, and data flow. Cloudairy Cloudchart even lets you integrate with diagramming tools to create specific visualisations of Prometheus and telemetry data.
Start using Cloudairy to design diagrams, documents, and workflows instantly. Harness AI to brainstorm, plan, and build—all in one platform.
Table of Contents

Introduction
 Manage all your work in one placeCollaborate with your teamUse Cloudairy for FREE—forever


 Related Articles

 – Design with Cloudairy Cloudchart.webp)