Bar Diagram Template

Cloudairy
AI Workspace for Diagrams & Collaboration
Get your team started in minutes
Sign up with your work email for seamless collaboration.
Whiteboard
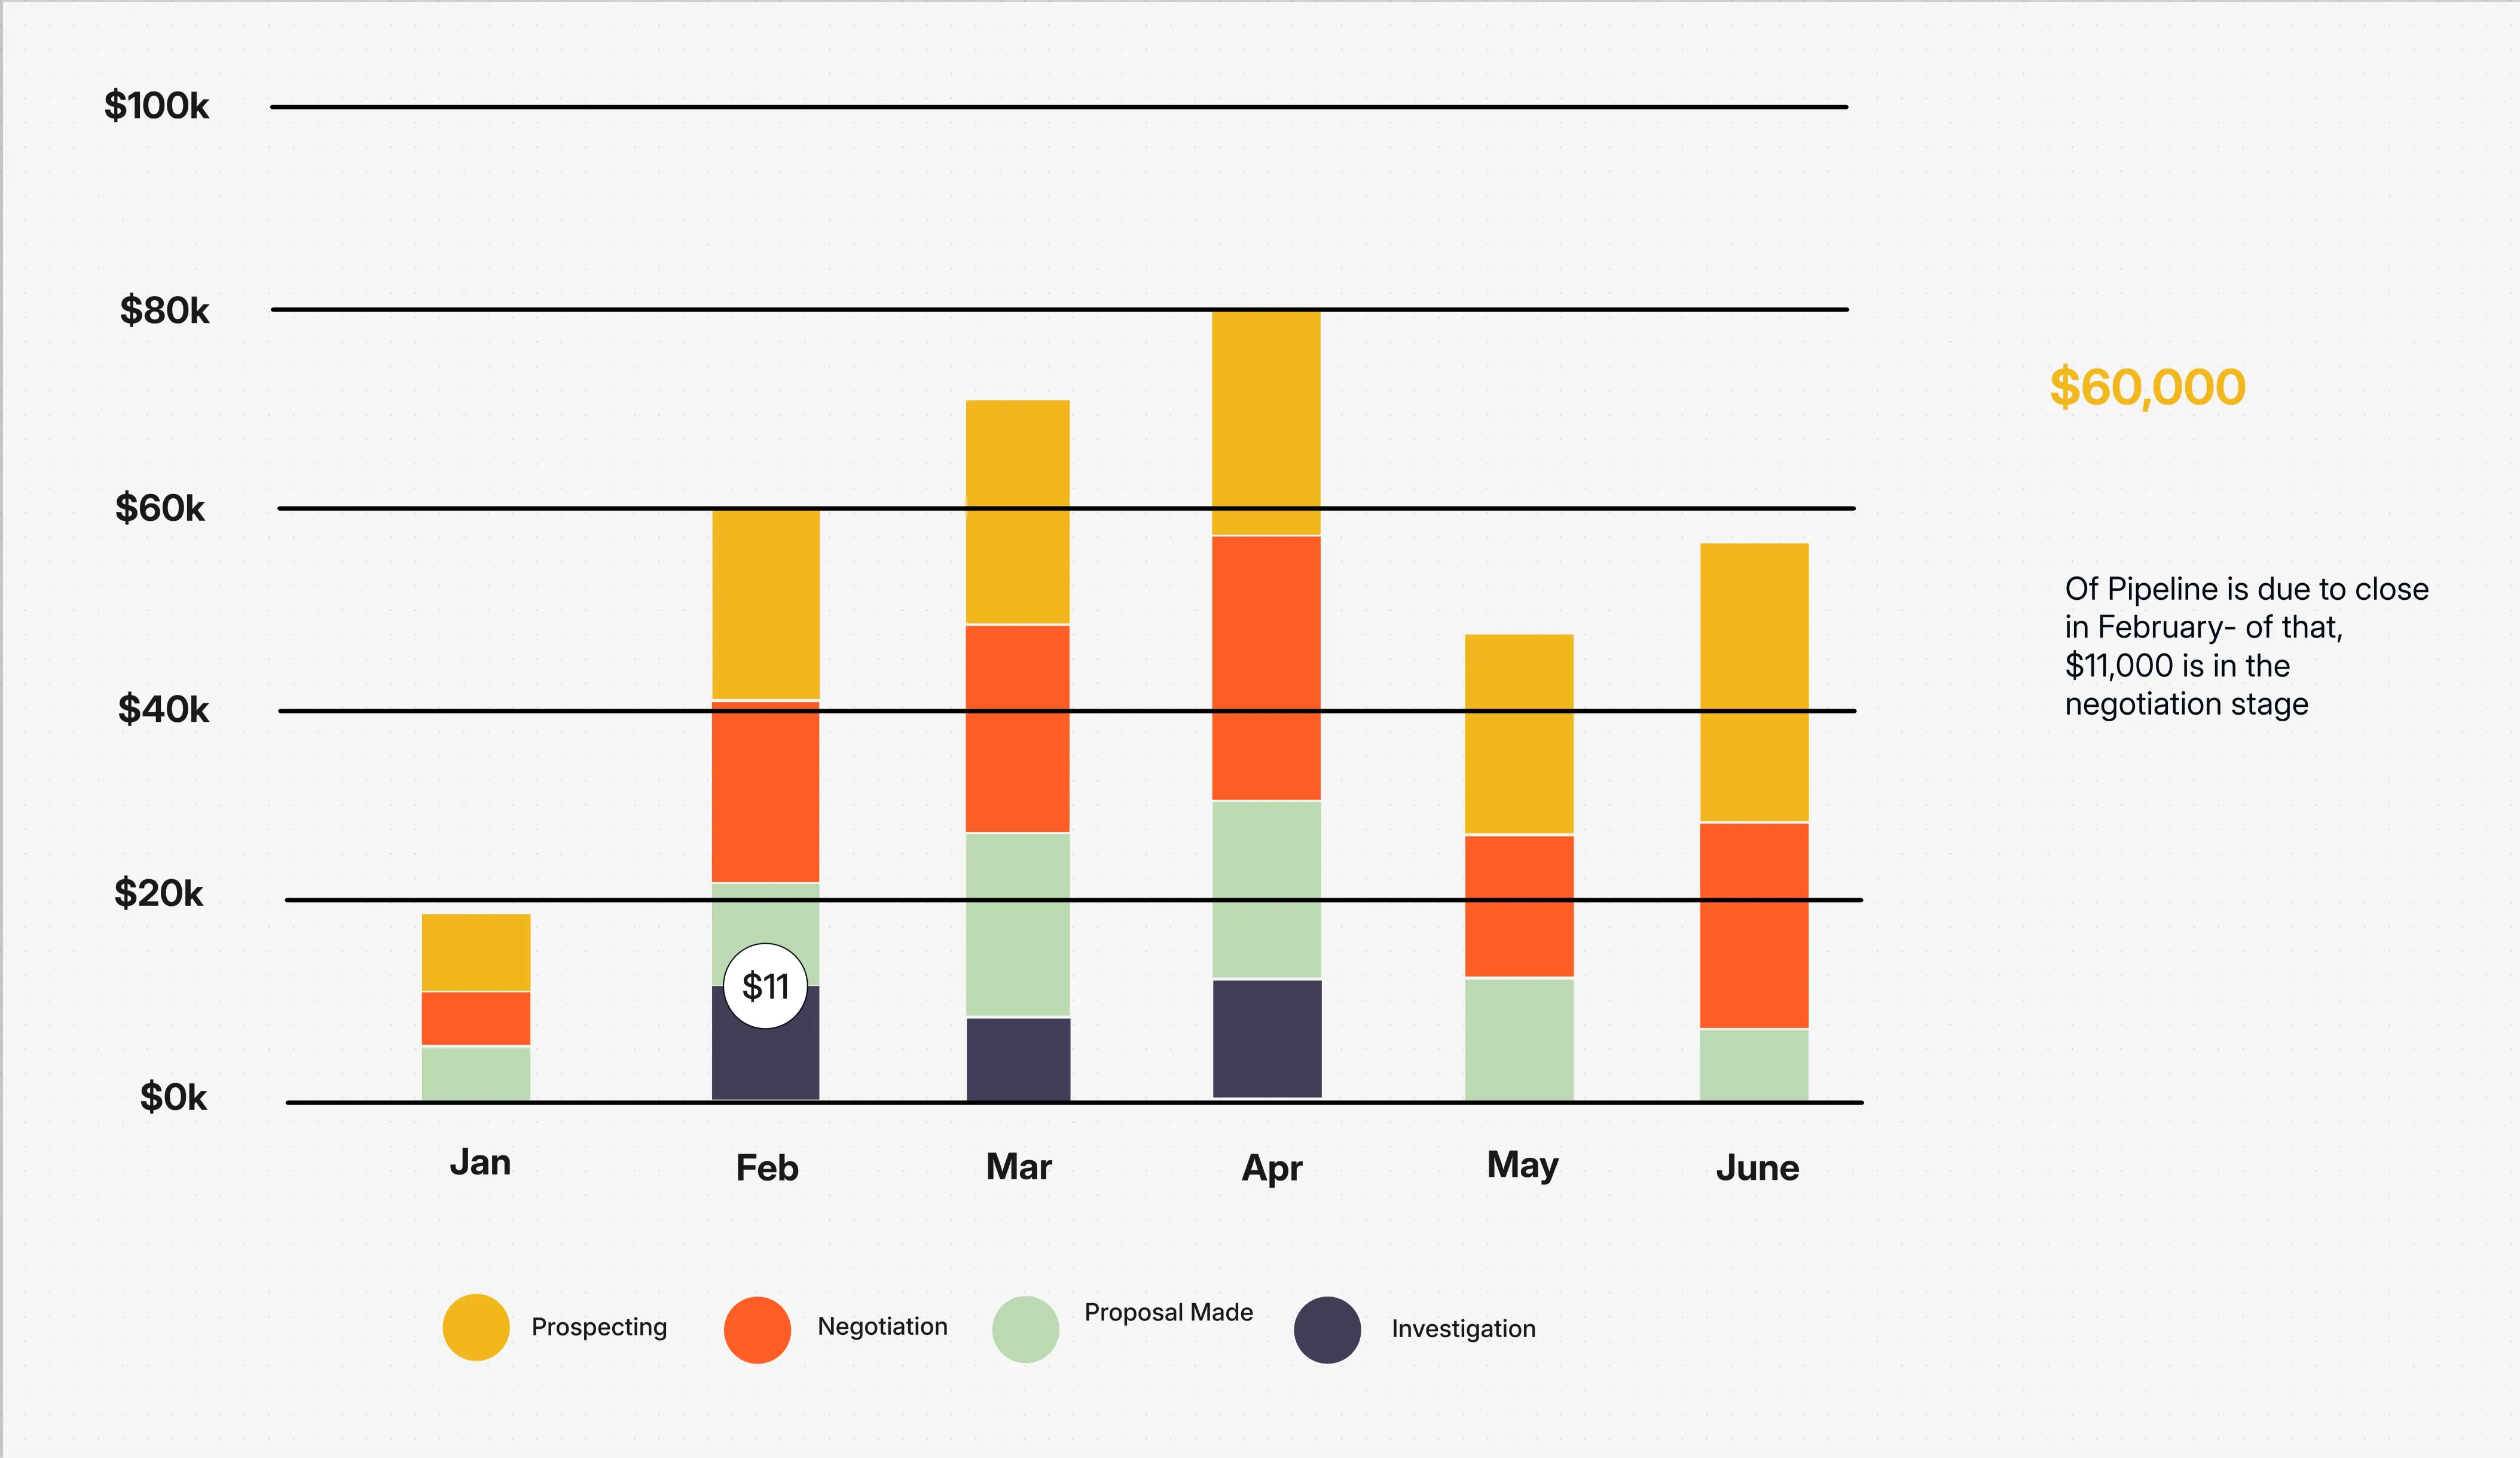
Create clear, insightful data comparisons with the Bar Diagram Template. Ideal for reports, analytics, dashboards, and performance tracking to highlight trends and measure results easily.
Create clear, insightful data comparisons with the Bar Diagram Template. Ideal for reports, analytics, dashboards, and performance tracking to highlight trends and measure results easily.
The Bar Diagram Template is a wonderful tool that makes your comparative data easy to understand, as it transforms difficult-to-grasp figures into straightforward visuals. No matter if you are showing financial trends, campaign results or productivity rates, bar charts display information so that it can be seen immediately.
With this template, it becomes easier for team members to assess their performance, monitor their progress and report the results in a neat and professional manner through visuals that are suitable for presentations, dashboards, and reports.
You possess the capabilities to produce visuals of a professional standard that can turn raw data into a comprehension that can be acted on.
Use the Bar Diagram Template anytime you need to compare values, highlight differences, or show progress across multiple categories. It’s especially valuable for marketing teams analyzing KPIs, finance departments reviewing quarterly reports, and project leads tracking milestones or costs.
This diagram replaces the tedium of the spreadsheet with visuals whose messages are loud and clear to ensure clarity in every presentation.
Customize your bar diagram effortlessly to make your visuals more meaningful and aligned with your brand identity.
This flexible diagram format fits any industry that relies on data-driven decisions and performance insights.
Turn your raw data into beautiful, comprehensible visuals with the Workflow & Process Diagram Maker. Build impactful bar diagrams for reports, dashboards, and performance reviews all without needing design skills.
Explore related resources:
1: Can I use the Bar Diagram Template for time-based comparisons?
Well, absolutely. Bar diagrams are the best option when it comes to monitoring changes over time. Just select the horizontal layout to indicate months, quarters, or years, and the graphic right away points out the performance trends.
2: Does this template support stacked and grouped bar charts?
Certainly. It is possible to go for the clicked single, stacked, or grouped bars according to the data you have. Grouped bars are most suitable for comparison of categories while stacked bars highlight the total contributions.
3: What’s the difference between a bar diagram and a histogram?
A bar diagram illustrates the differences in numbers among distinct categories (such as different departments or products), whilst a histogram presents the frequency distributions of continuous data (like different age or income ranges).
4: Can I use this in a live dashboard or report?
Indeed. Your chart can be included in dashboards, reports, or PowerPoint presentations. The template provides simple data linking and real-time updates for automated reporting, thus supporting it easily.
5: Is it possible to apply custom branding?
Yes, one can set up their diagrams to align with their organizational branding by considering elements like color palette, typography, and logos position.
Loading subcategories...
 Manage all your work in one place
Collaborate with your team
Use Cloudairy for FREE—forever
Explore More