AWS
Architecture Diagramming with CloudChart for Clear Designs

AI Workspace for Diagrams & Collaboration
Get your team started in minutes
Sign up with your work email for seamless collaboration.
Architecture diagramming is like creating a roadmap for a complex software system. It involves building diagrams to show how different parts of the software work together. These diagrams or pictures help everyone involved, from developers to managers, understand the system's structure and how it functions.
This diagram includes things like:
By assembling these components, you can visualize how all the elements interconnect and function as a unified entity. To clarify this Architecture Diagram, we utilize shapes, lines, and labels, which help demonstrate the connections between components and their functions. For a deeper understanding of system structure, a software architecture diagram helps visualize how applications, services, and infrastructure components interact.
.webp)
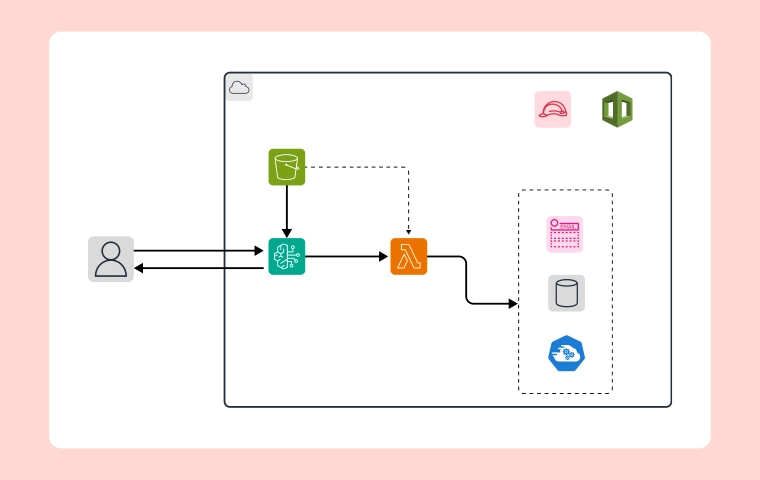
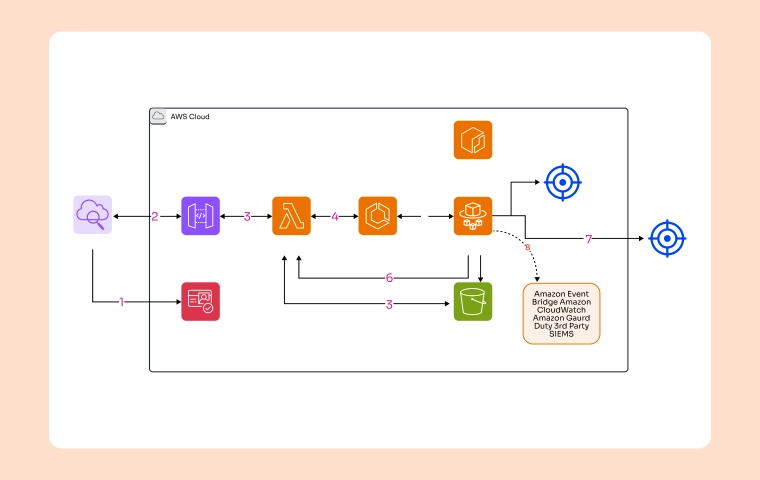
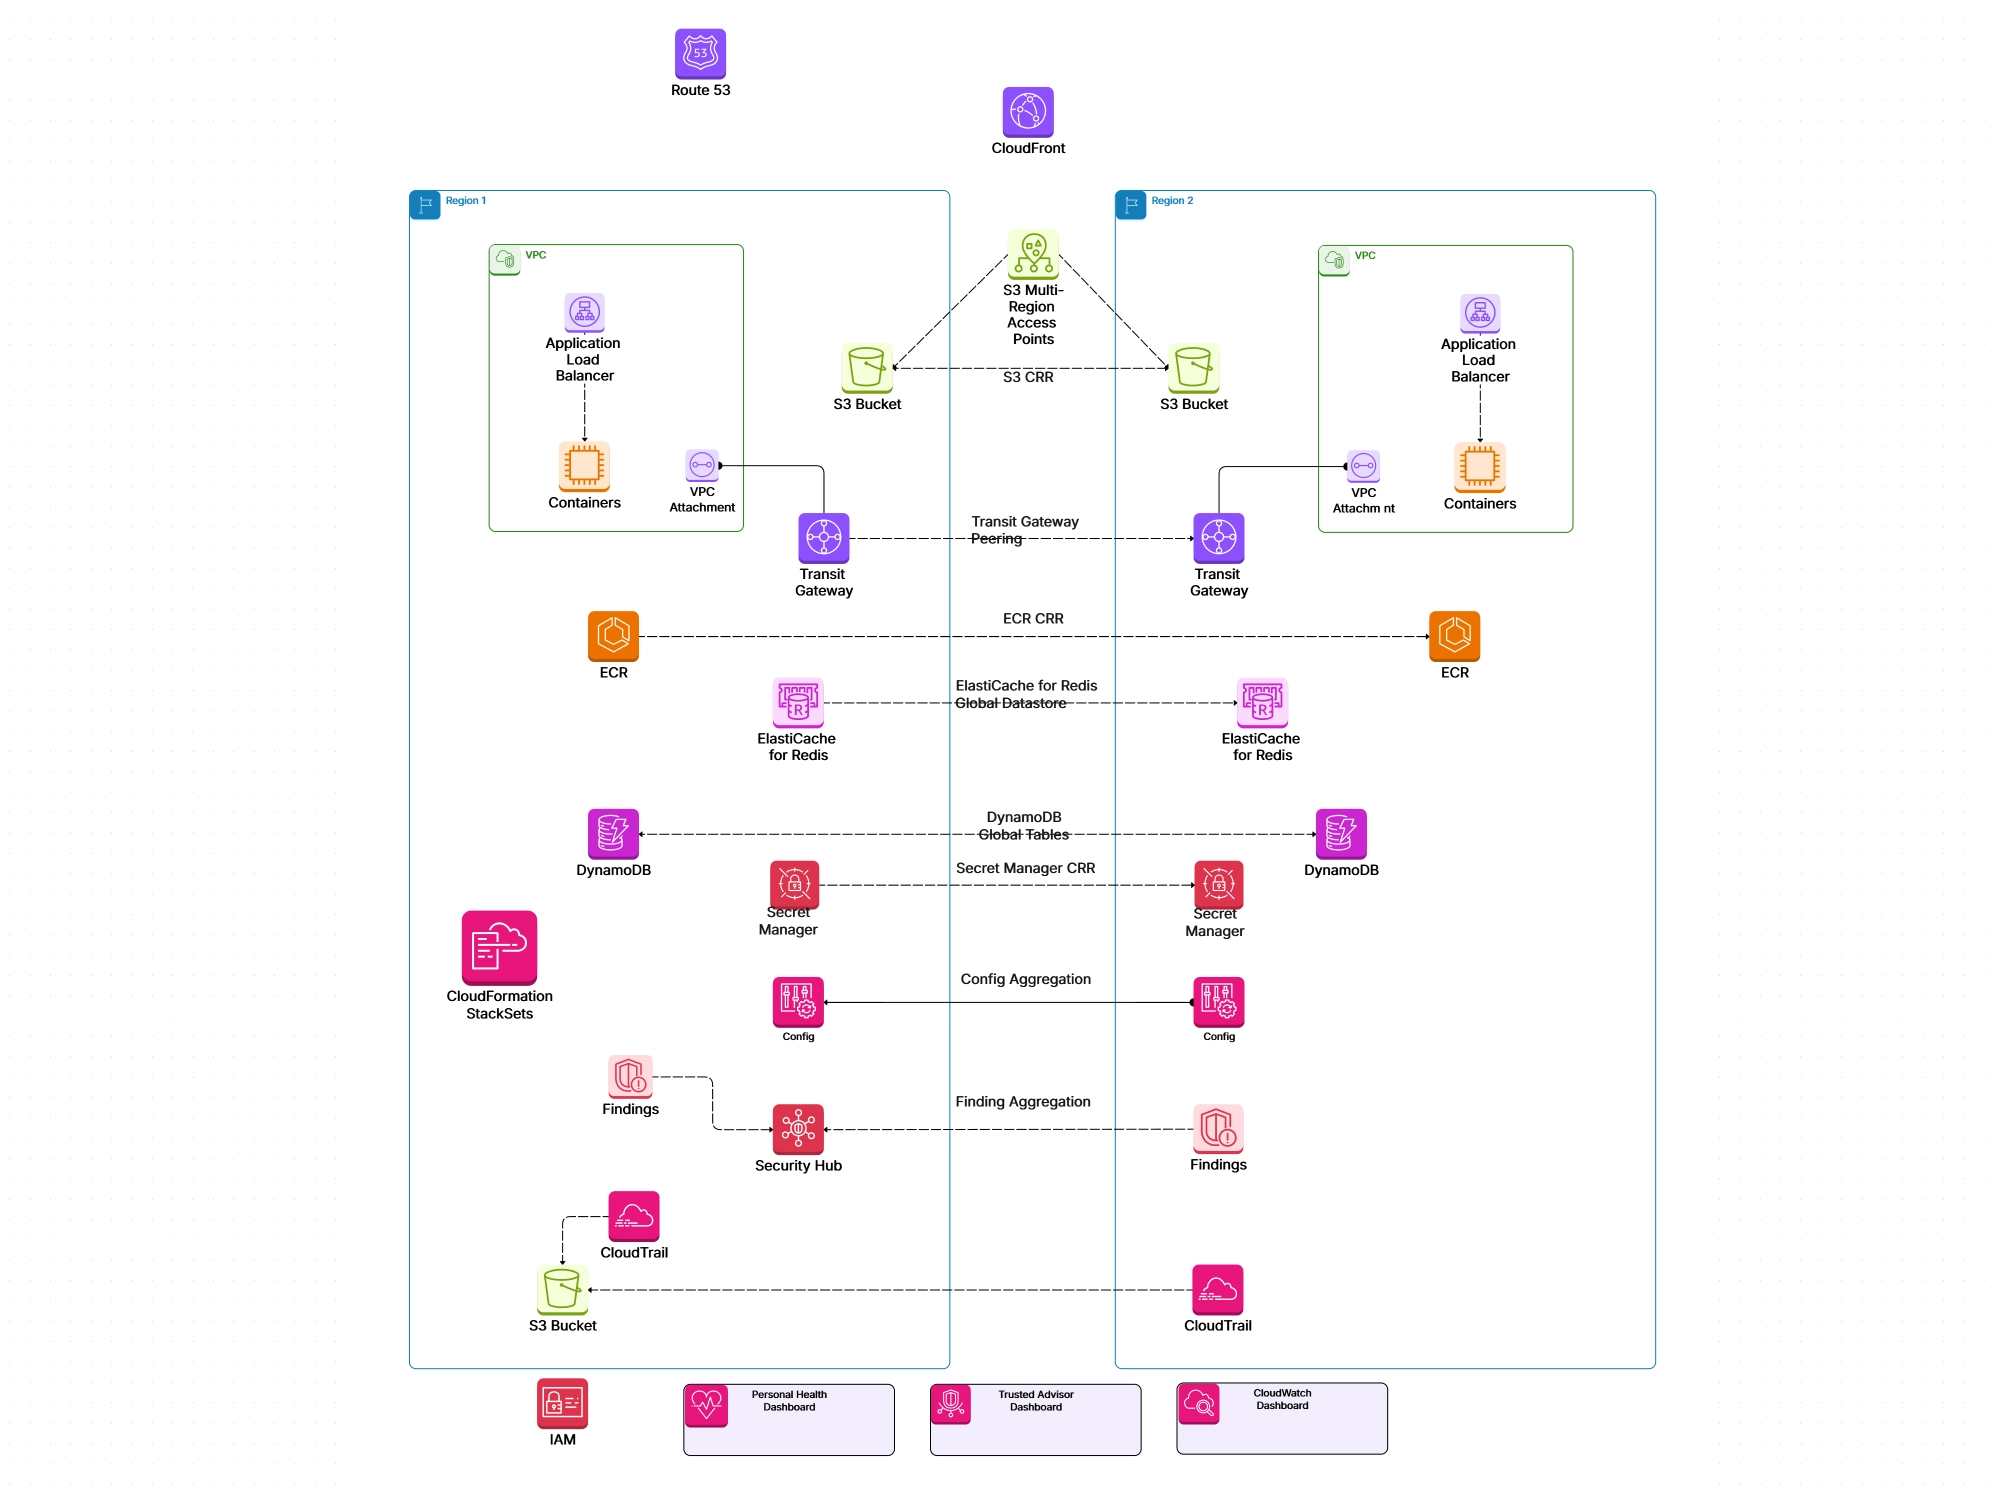
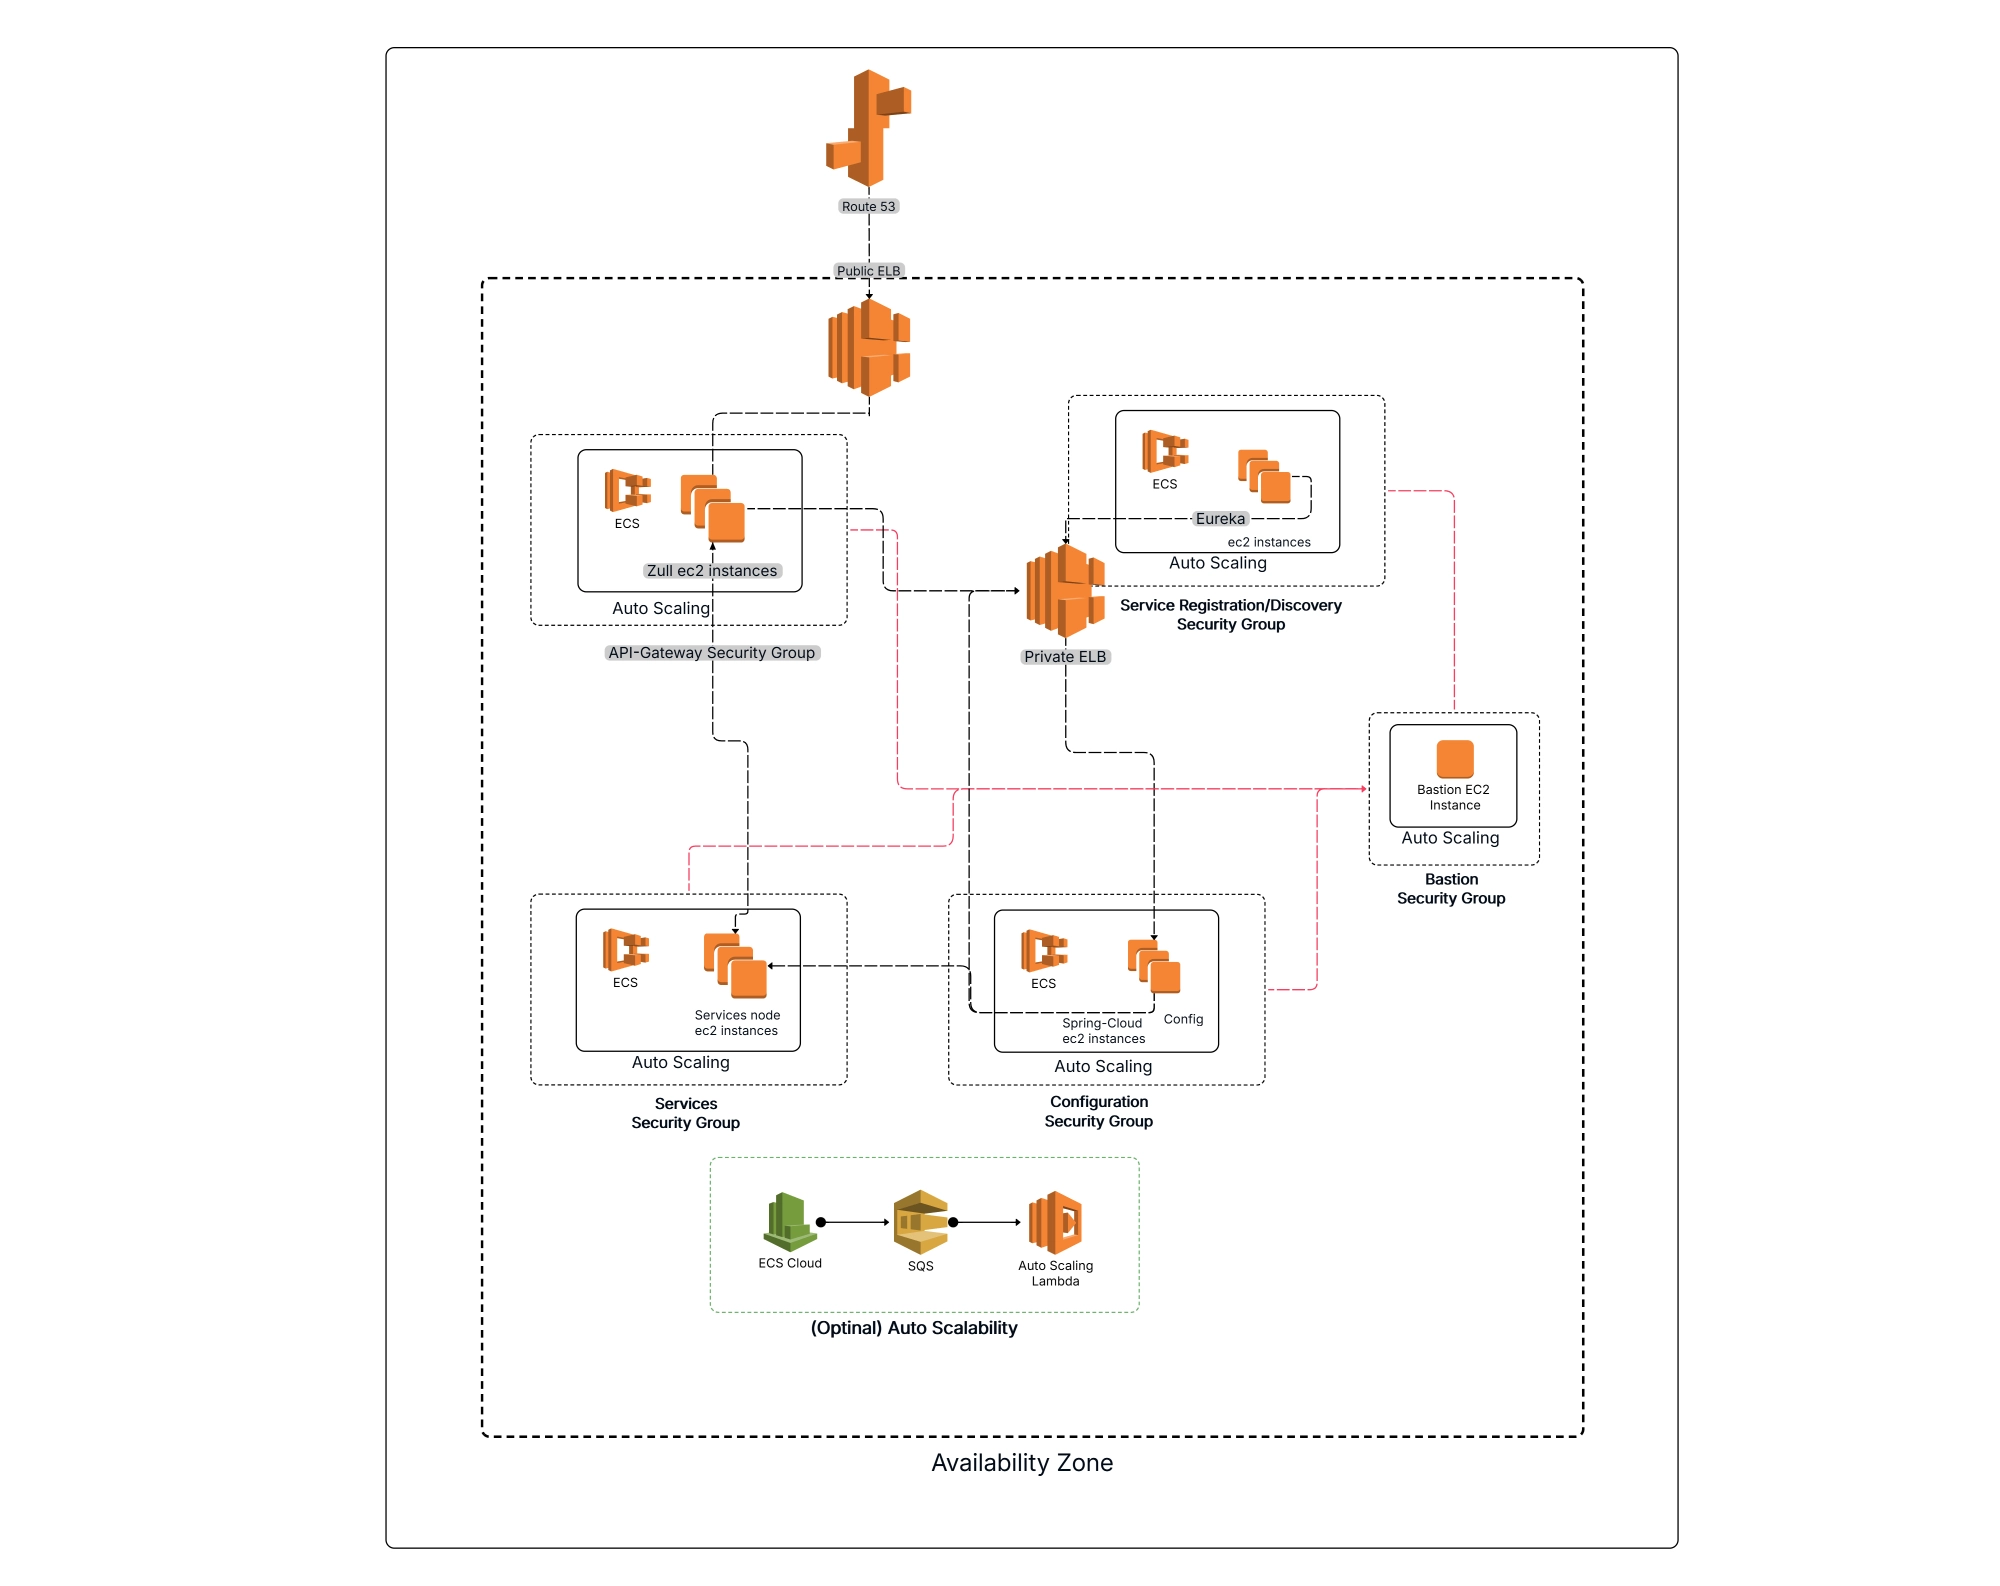
AWS Architecture Diagrams are visual representations of how applications and systems are built and run on Amazon Web Services (AWS).
Think of them as a roadmap or blueprint for your cloud infrastructure. They help you understand how different AWS services work together to support your applications and workloads. To understand how architecture diagrams support scalable infrastructure, you can explore real examples of a cloud computing architecture diagram used in modern enterprise systems. Let’s understand them with a few real-world examples:
At Cloudchart we offer a library of pre-built symbols and templates that represent different AWS services. This means you can quickly put together professional-looking diagrams without starting from scratch.
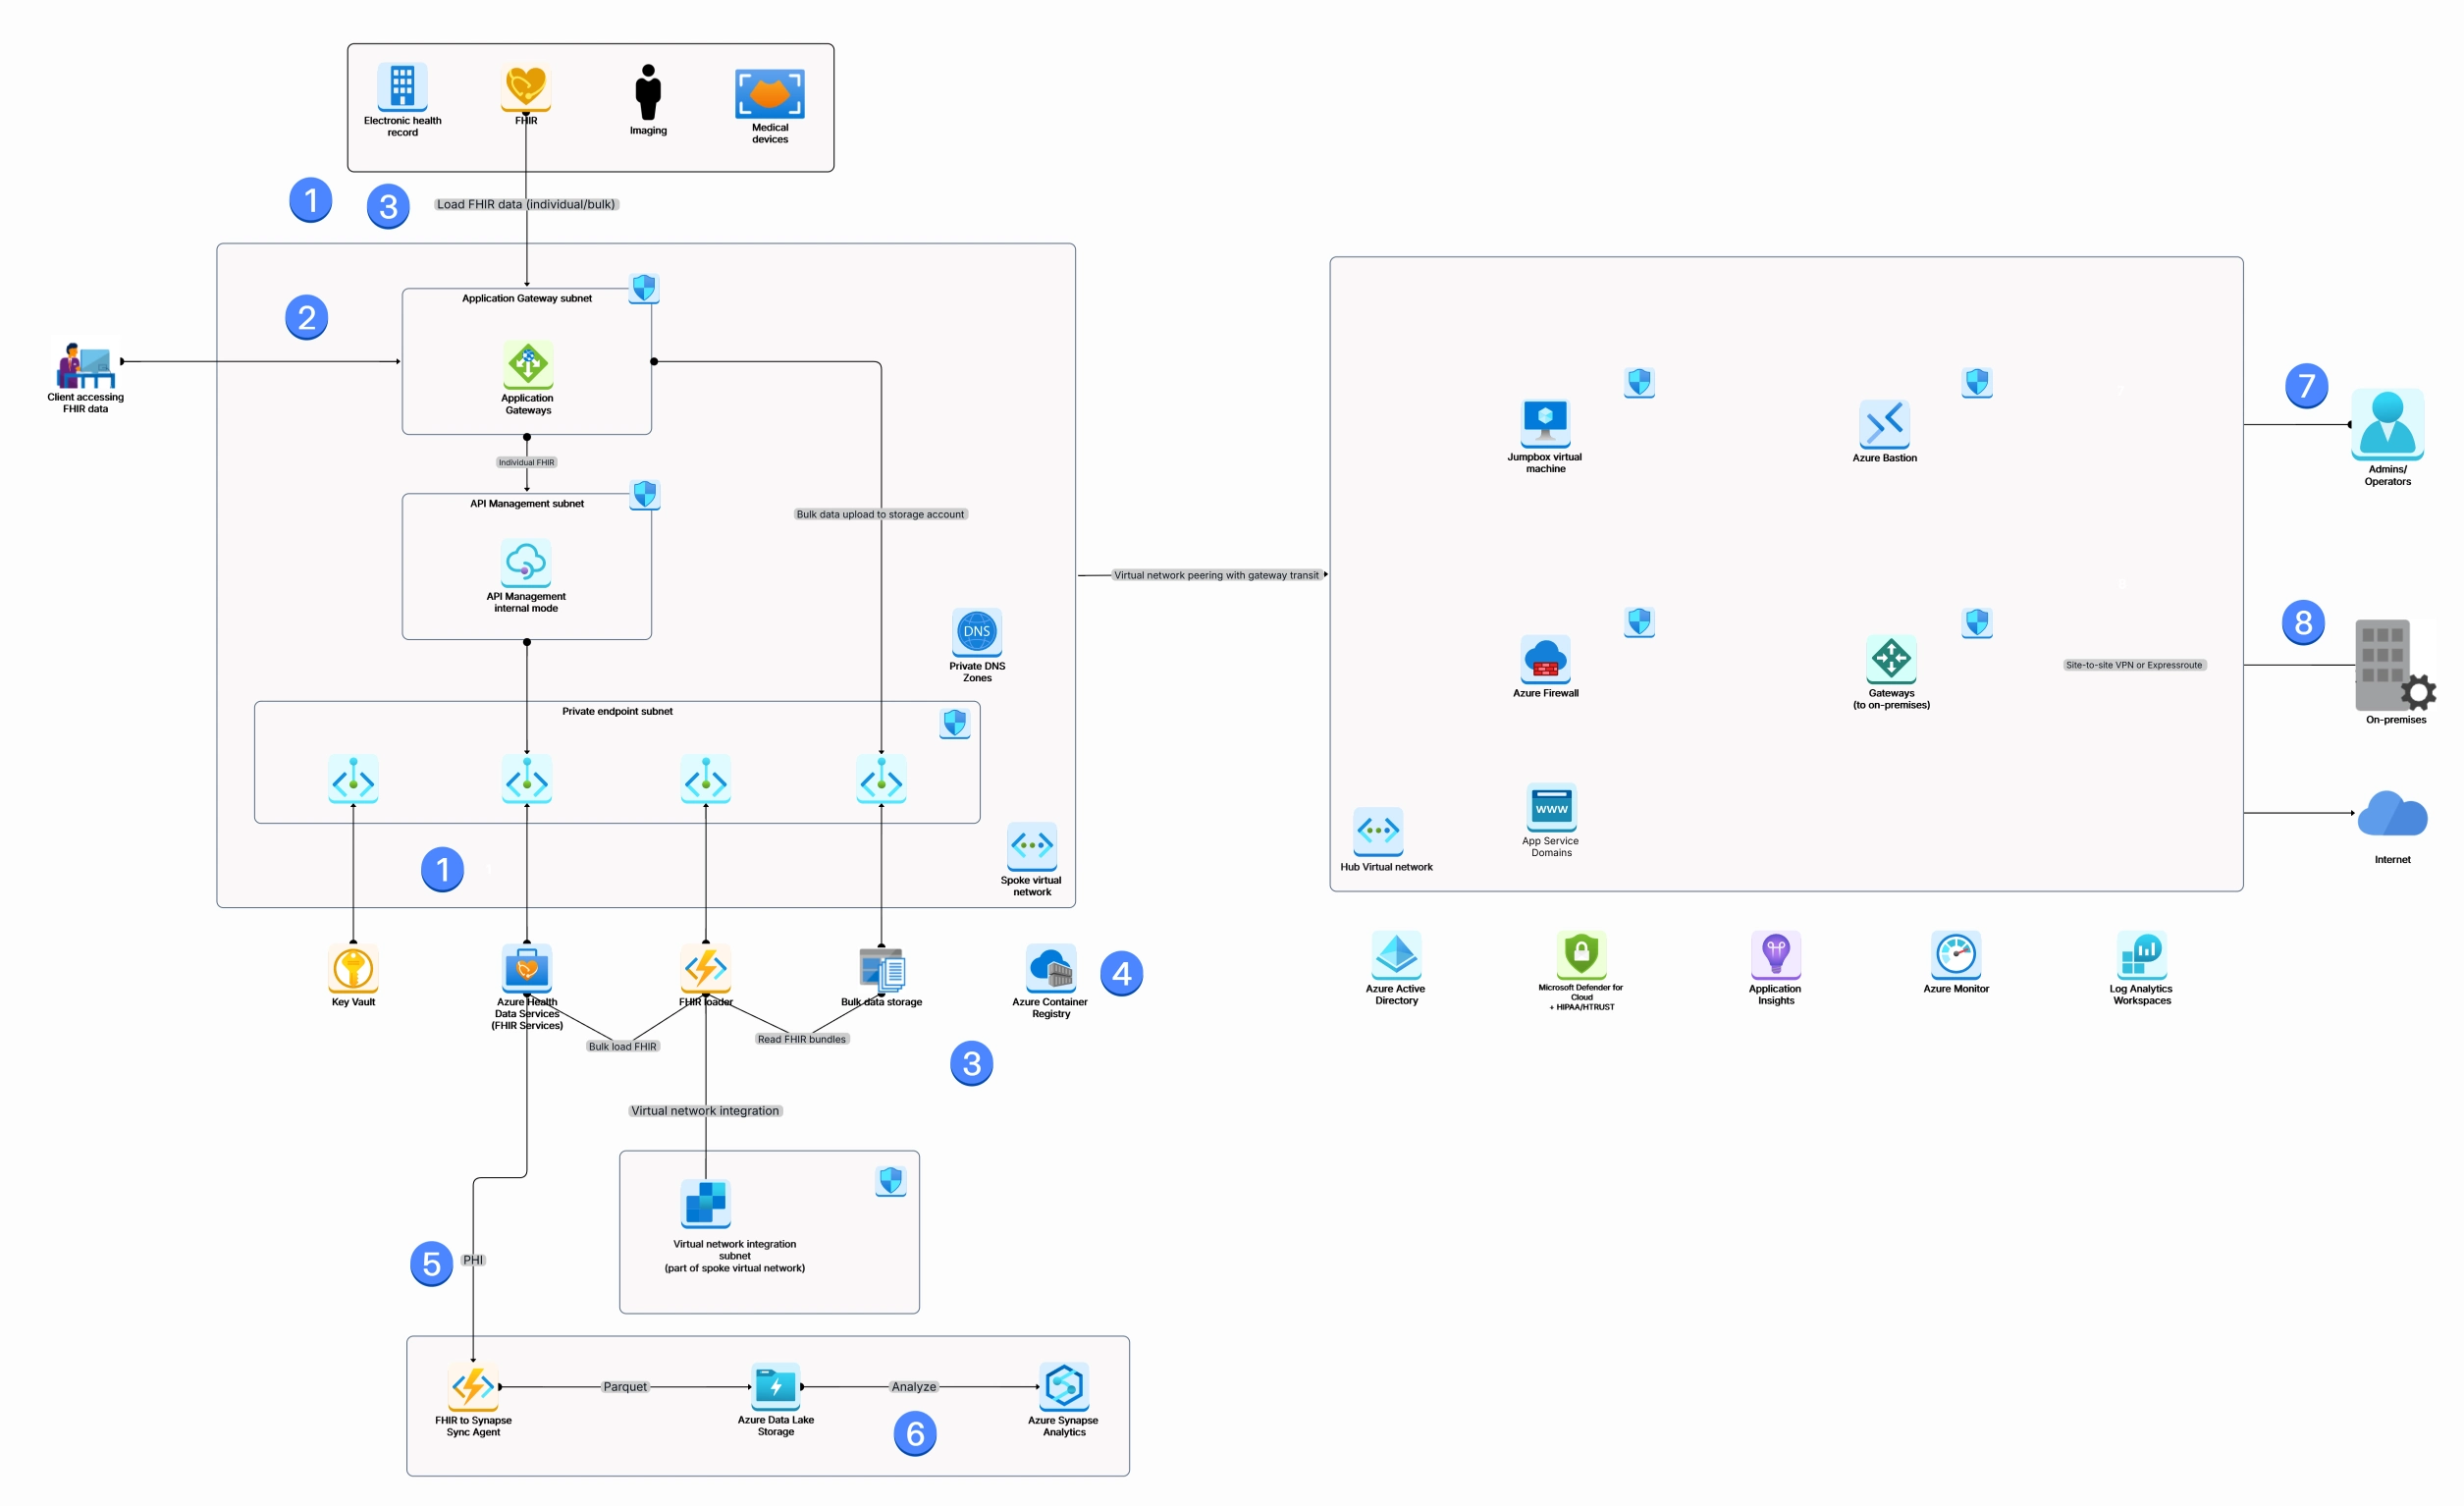
Azure architecture diagrams depict Microsoft Azure environments, detailing components like virtual networks, subnets, and Azure SQL databases. They are like blueprints for your Azure cloud projects. They show how different Azure tools fit together to make your cloud work. Just like a house needs a plan, your cloud needs a diagram.
Imagine you're building a website on Azure. A diagram would show how your website's data is stored, how people connect to it, and how it handles traffic. Cloudchart makes it easy to create these architecture diagrams with ready-made pieces that represent different Azure services.
Think of Cloudchart as your personal architect for the cloud. We provide the tools, you create the masterpiece.
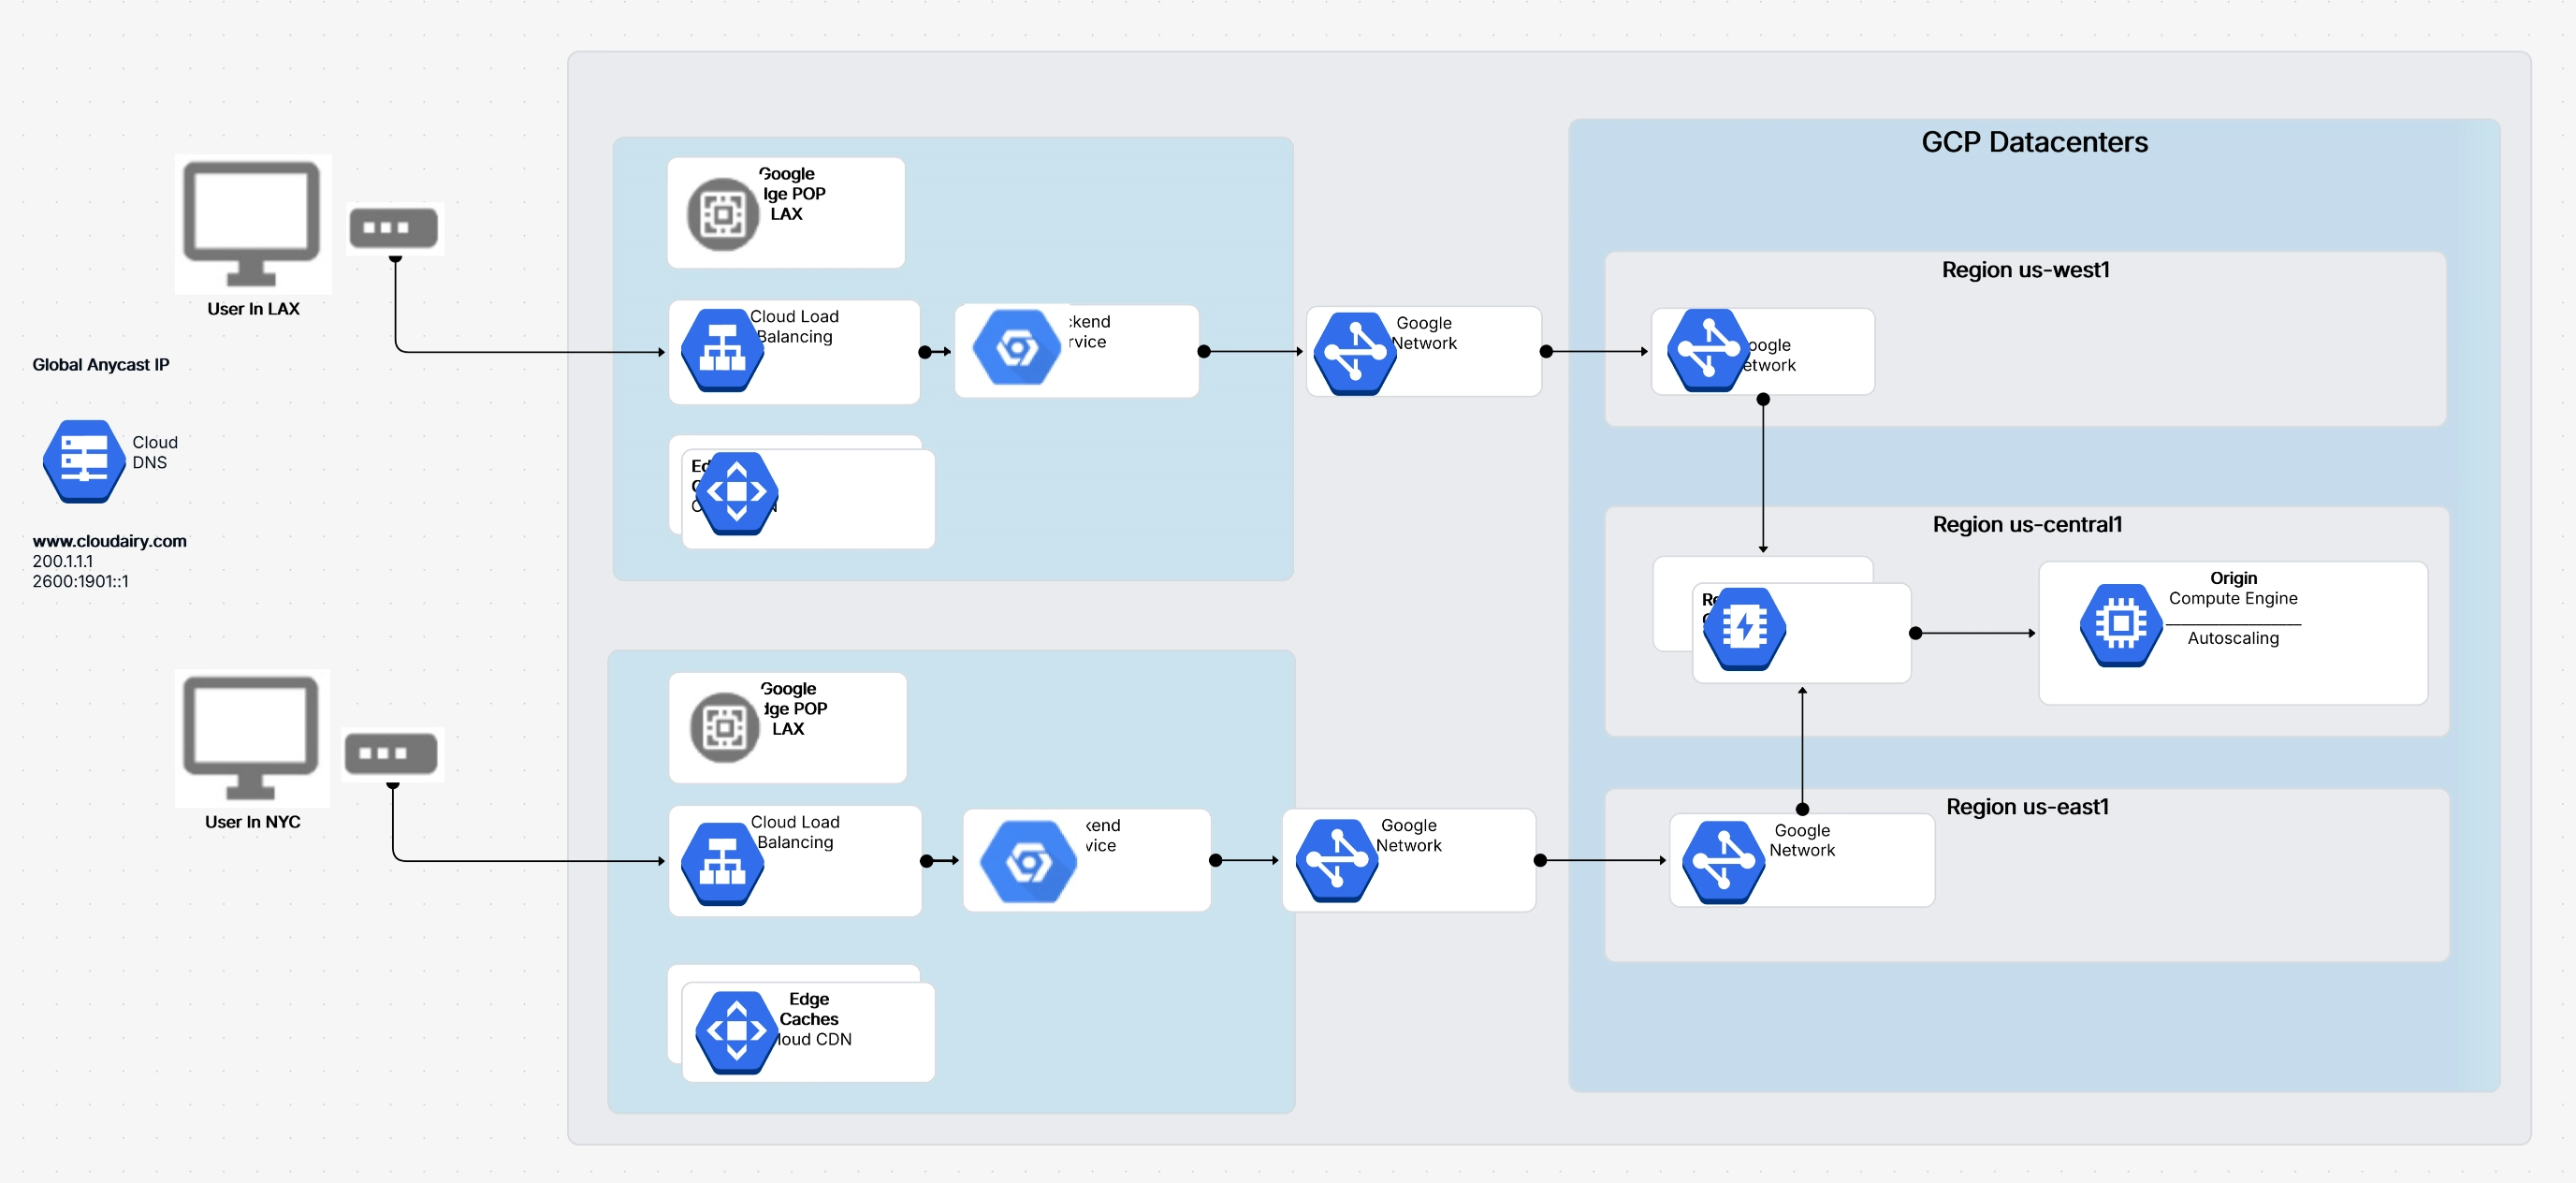
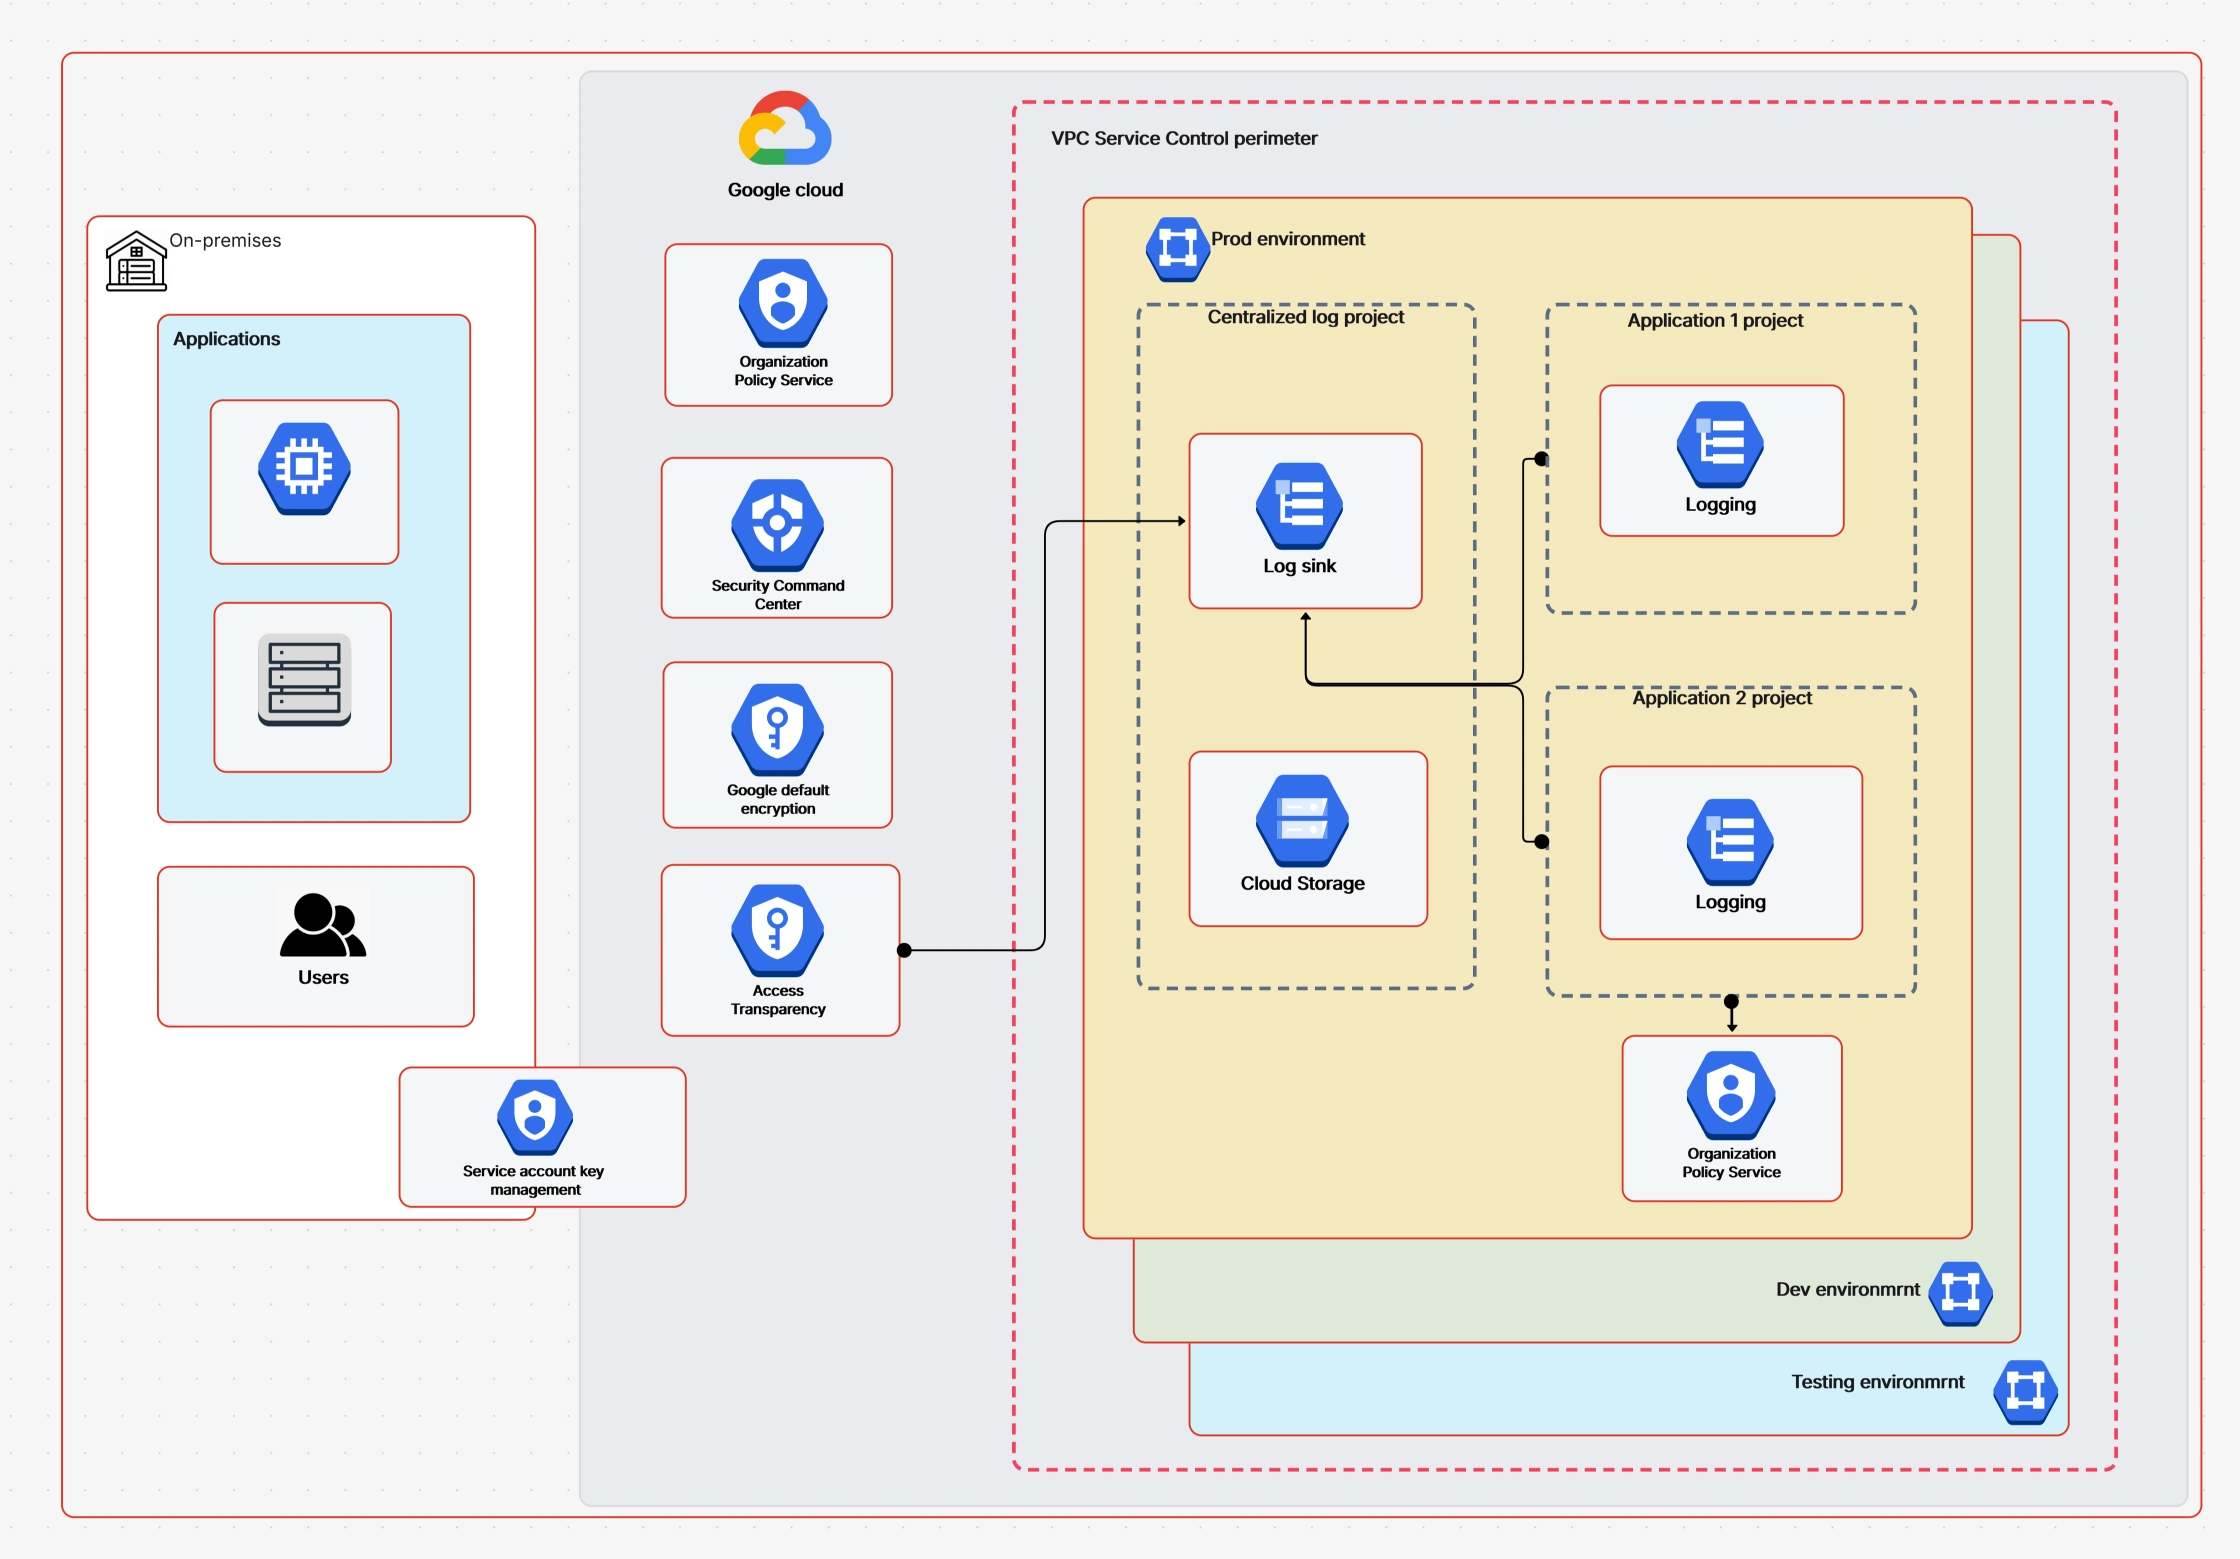
GCP architecture diagrams provide a visual representation of how your applications and data are structured within the Google Cloud Platform. They serve as a roadmap, outlining the interconnectedness of Google Cloud services and resources. By visually mapping out components like Compute Engine instances, Cloud Storage buckets, and Cloud SQL databases, these diagrams offer a comprehensive overview of your cloud infrastructure.
Let’s understand this with some real-world examples:
Cloudchart simplifies the process by providing a rich library of GCP-specific icons and templates, allowing you to efficiently create professional-quality diagrams.
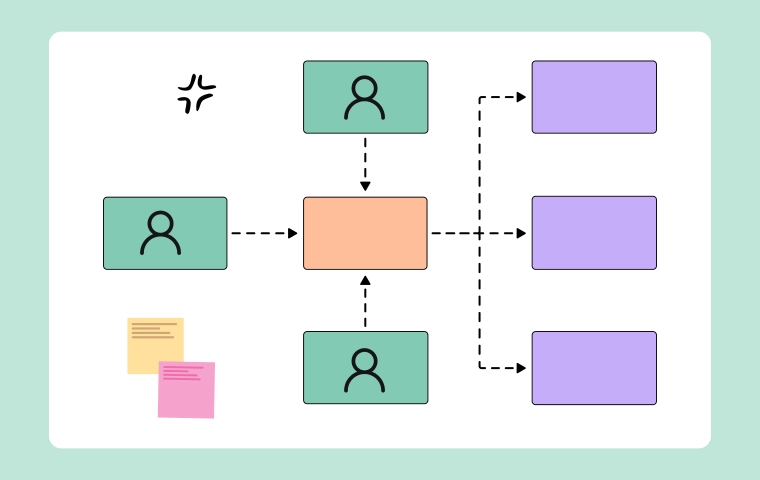
Imagine you're ordering pizza. You (the customer) are the client. The pizza place (the server) takes your order, makes the pizza, and delivers it to you. This is like a client-server setup.
In computer terms, a client is your computer or phone. It asks for something, like a web page or an email. A server is a powerful computer that stores and provides this information. When you make a request, the server finds what you need and sends it back to your device.
This is how many websites and online services work. Your computer is the client asking for information, and the website's server provides it. In essence, the client-server model divides tasks between the requester (client) and the provider (server), making systems more efficient and scalable.
Cloudchart can help you visualize this relationship by creating architecture diagrams that show how clients and servers interact. You can use Cloudchart's shapes and lines to represent different components and their connections, making it easier to understand complex systems.
SOA is like building with pre-made blocks. Instead of creating everything from scratch, you use ready-made pieces called services. These services do specific tasks and can be combined in different ways to build larger applications.
Imagine a restaurant. They have different sections: cooking, serving, and billing. Each section is like a service.
These services work together to provide you with a meal. In software, services can be things like checking a customer's credit, calculating a total or sending an email.
Benefits of SOA:
Cloudchart can help you create diagrams to show how different services interact. You can use shapes to represent services, lines to show connections, and labels to explain what each service does. This helps you understand the overall architecture and identify potential improvements.
By using SOA and tools like Cloudchart, you can build more complex and adaptable software systems.
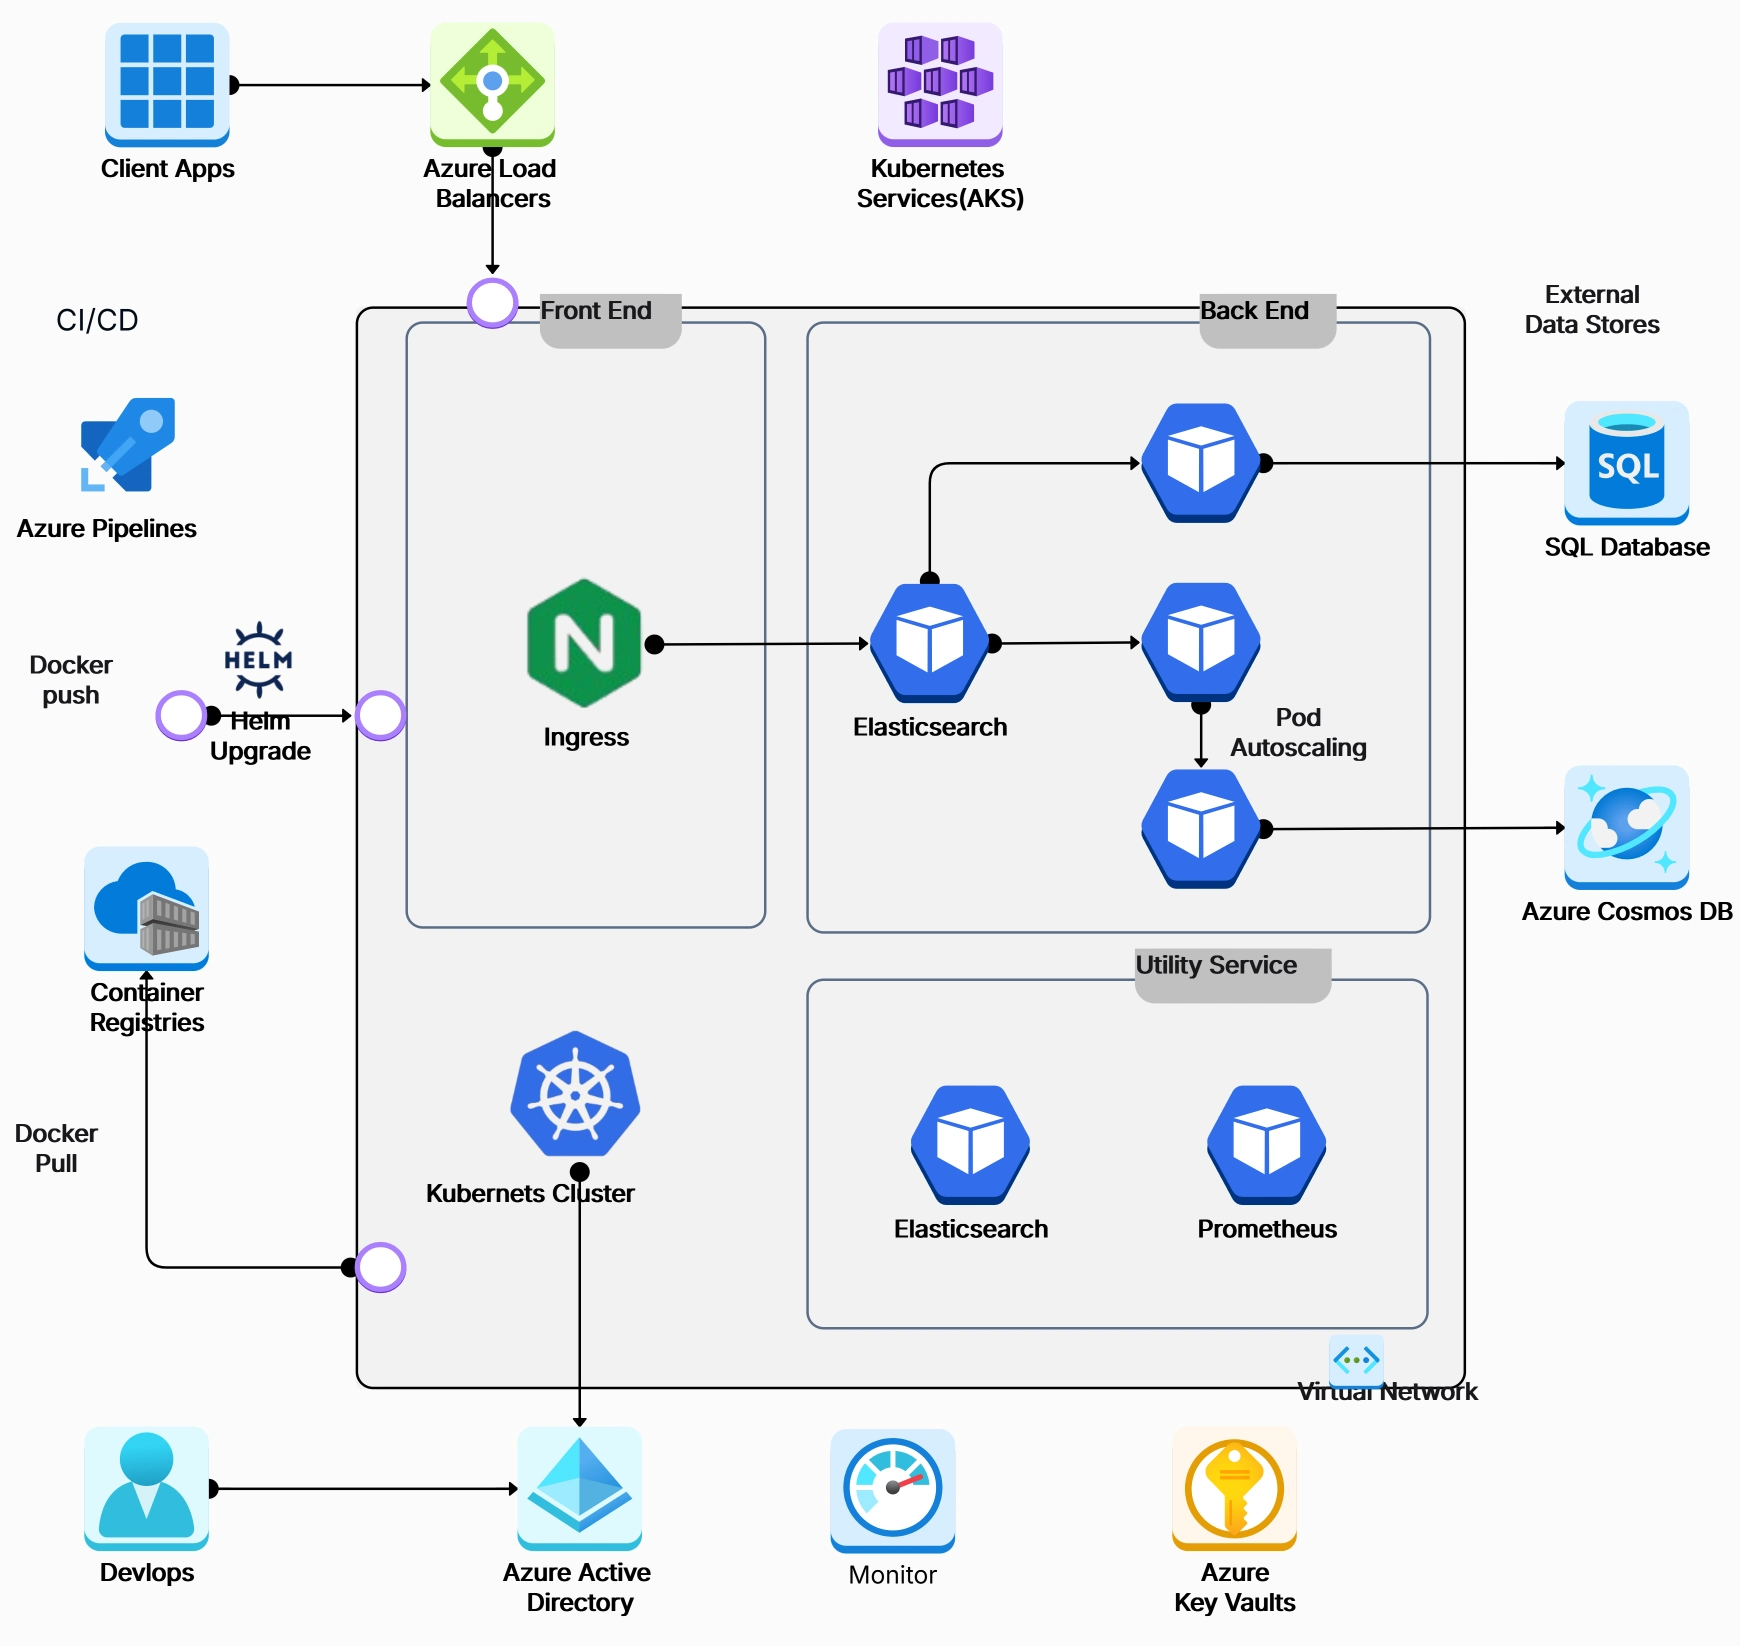
Microservices Architecture is like creating small independent services and snapping them together. Each service has a specific job and can be changed or replaced without affecting the rest of the work. Architecture diagrams are essential for understanding microservices. In container-based environments, a Kubernetes architecture diagram helps visualize how clusters, nodes, and services work together. They help visualize how these small services interact and work together. Cloudchart can be used to create these diagrams, making it easier to see the big picture.
By breaking down applications into smaller, manageable services, microservices architecture offers greater agility and adaptability.
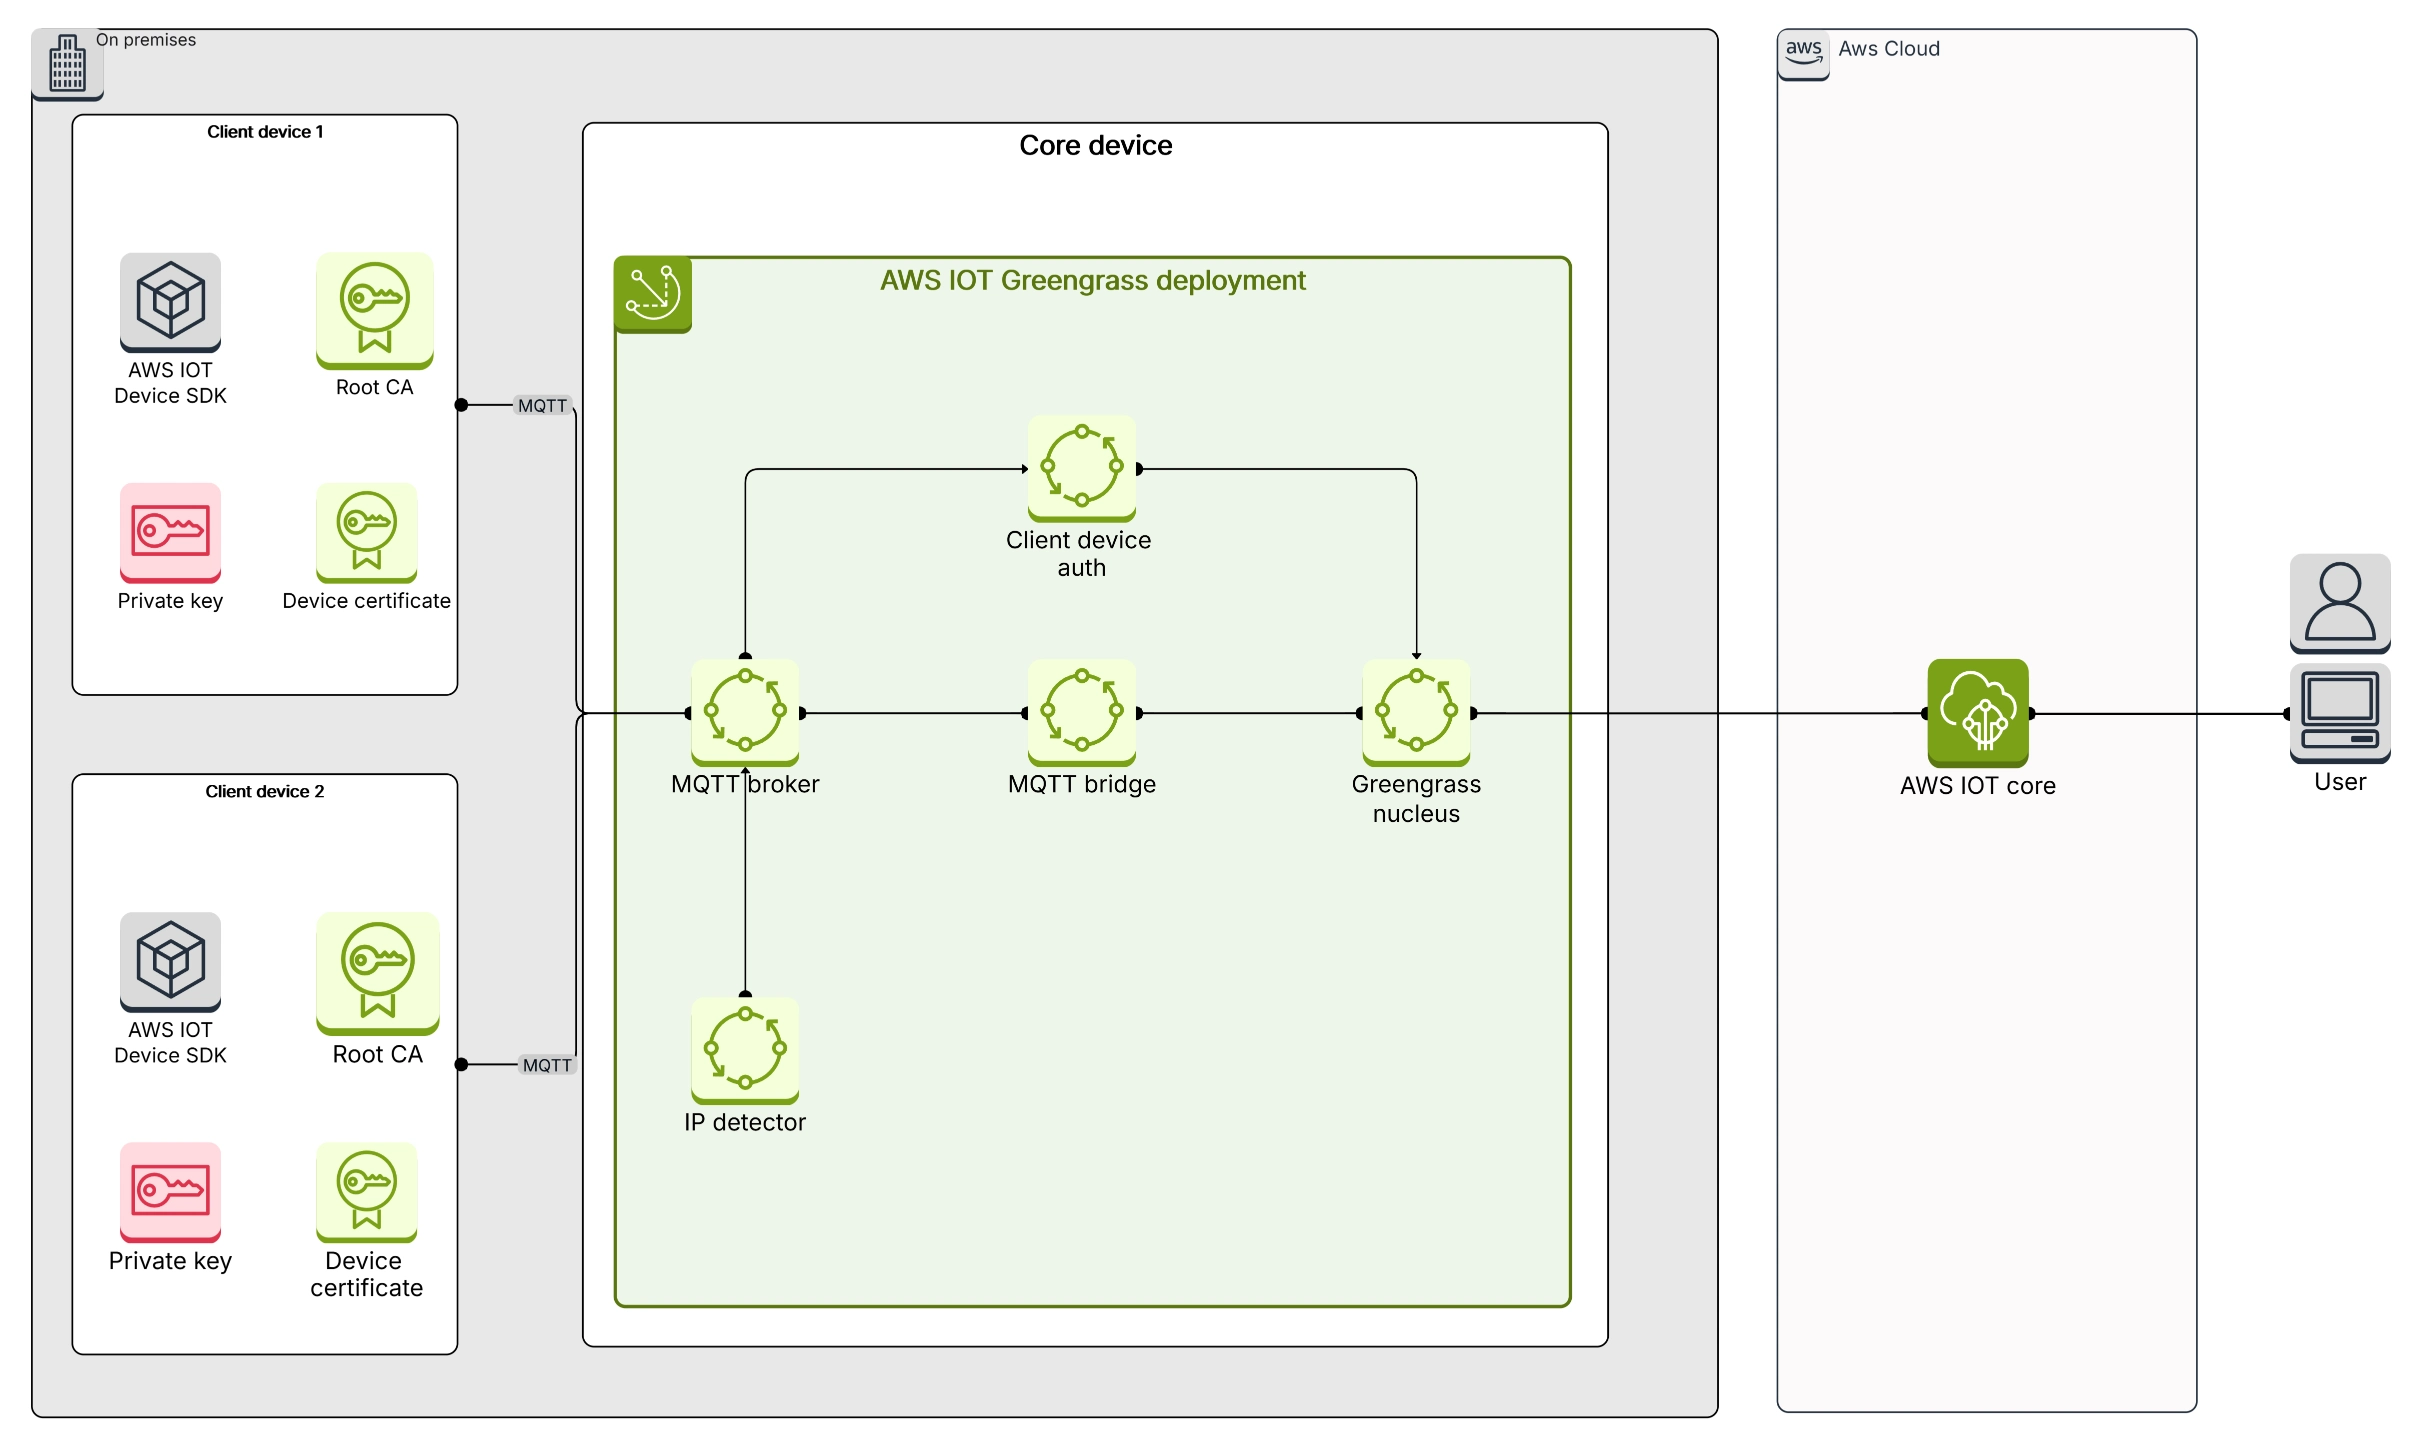
Cloud-centered architecture maximizes the cloud's unique capabilities by utilizing tools such as containers, microservices, and automated processes to create adaptable and scalable systems.
Think of it as building with digital blocks that can easily be added, removed, or changed. This makes it easier to adapt to changing needs and ensures the system runs smoothly even when things get busy.
Architecture diagrams are crucial for understanding cloud-centered architectures. They help visualize how cloud-specific components like containers and serverless functions interact.
Cloudchart can help you create these architecture diagrams by providing templates and symbols for cloud-specific components. This makes it easier to communicate your cloud designs to not only techies but to stakeholders as well so that they can build highly adaptable and efficient cloud applications.
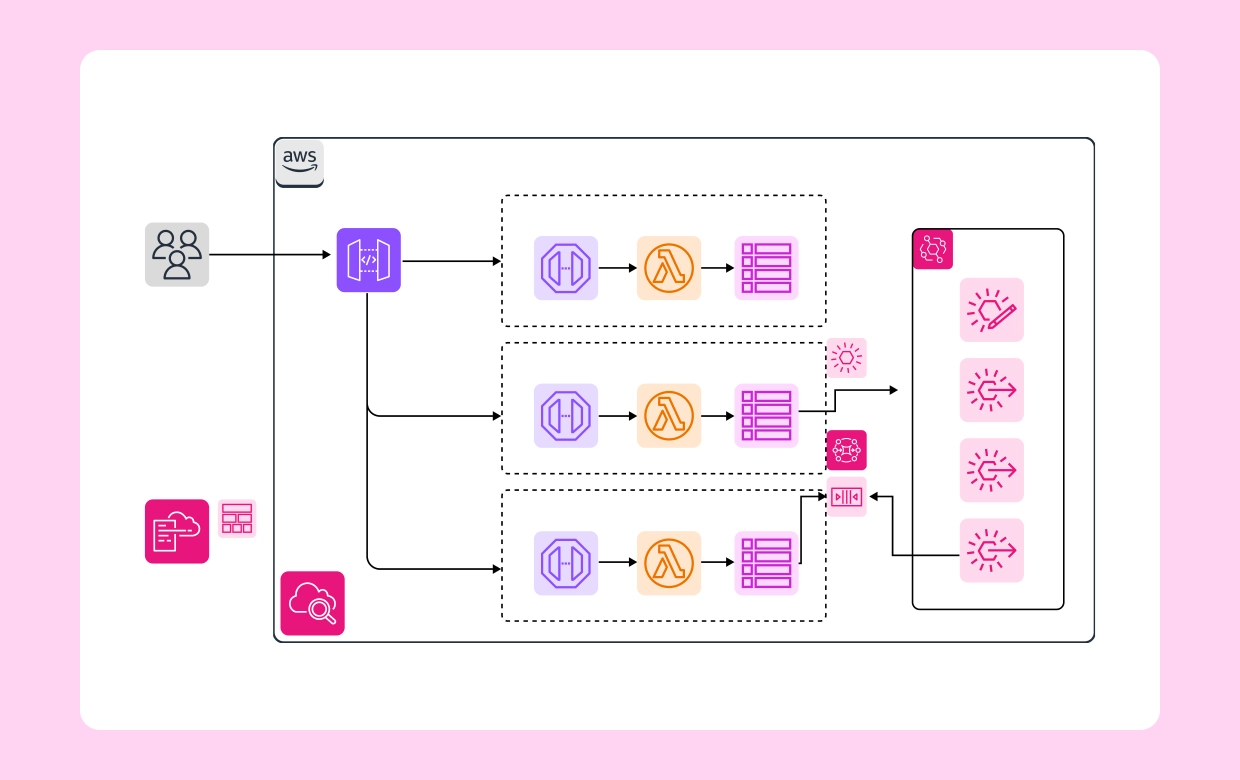
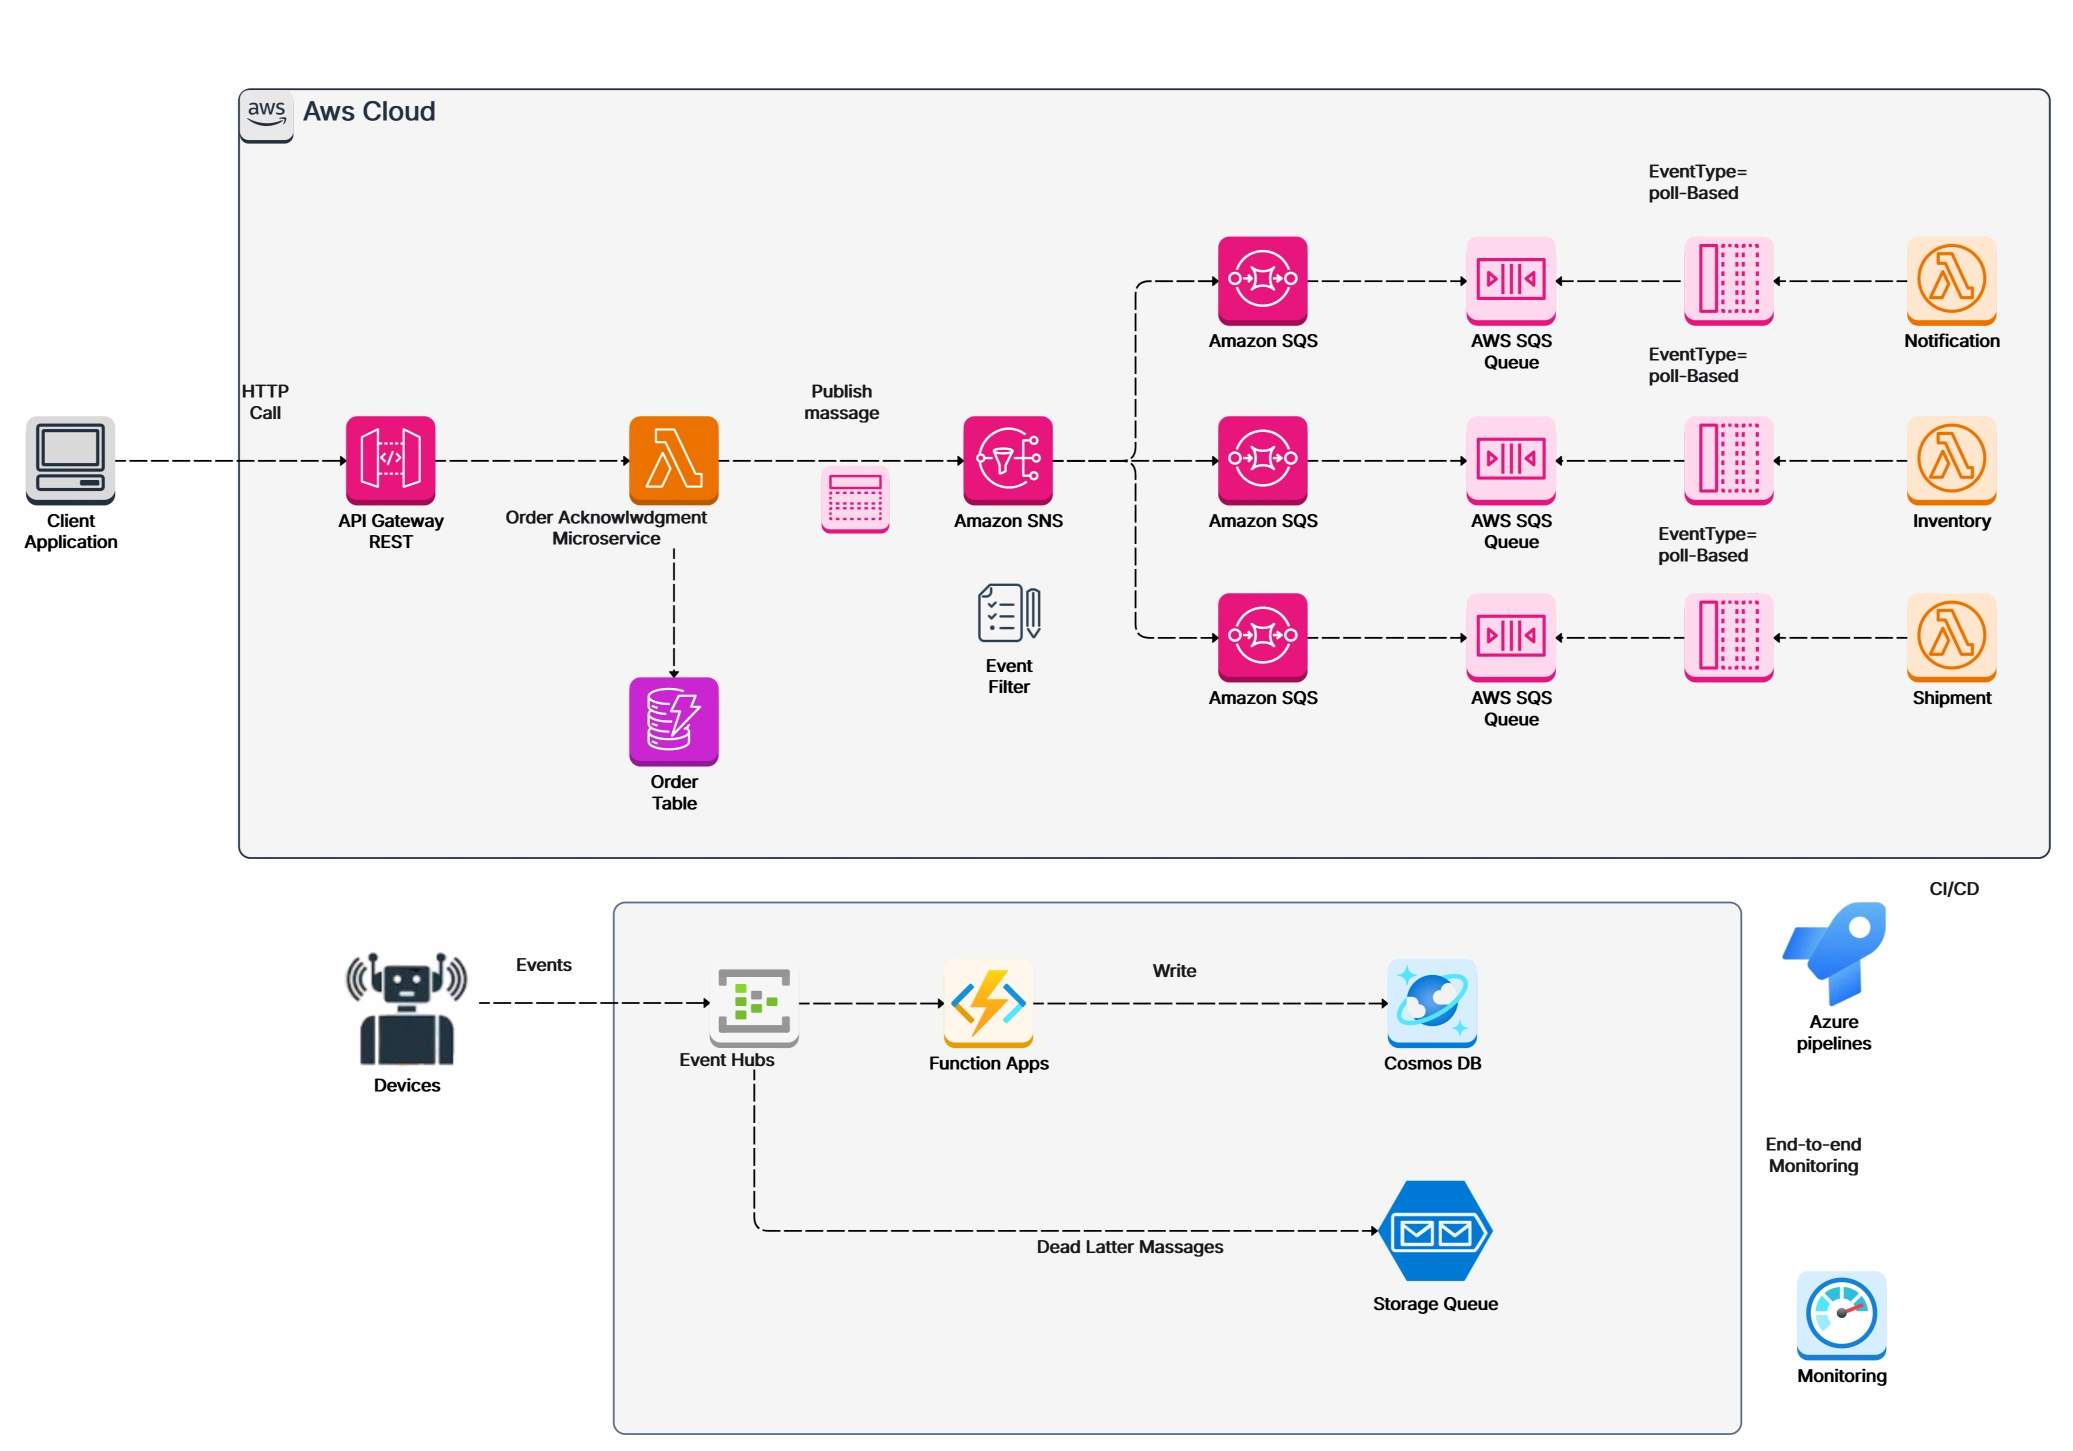
Event-driven architecture (EDA) is like setting up a notification system. Instead of constantly checking for updates, you wait for something to happen (an event) and then react. This makes systems more responsive and efficient.
Imagine an online store. When someone buys something, it triggers a chain of events: an order confirmation email, updating inventory, and processing payment. EDA handles these events smoothly.
Architecture diagrams are essential for understanding complex event-driven systems. They show how events flow through the system and how different components respond. Cloudchart can be used to create visual representations of these event flows, making it easier to analyze and optimize the architecture.
By using EDA and tools like Cloudchart, businesses can build systems that are more reactive, scalable, and able to handle large volumes of data.
Layered architecture is like stacking building blocks. Each layer has a specific job, and they work together to create the whole system. The layered architecture separates applications into logic-based layers, simplifying complex systems. Common layers include presentation, business, and data, which can be organized hierarchically to improve maintenance and scalability.
Benefits of Layered Architecture:
Cloudchart can help you create diagrams to show these layers and how they connect. You can use shapes, lines, and labels to represent each layer and its components. This visual representation makes it easier to understand and communicate the system's structure.
Architecture diagrams are like blueprints for software systems. They show you what makes up the system and how everything connects, which typically includes:
1. User-Friendly Interface
Cloudchart offers an intuitive drag-and-drop interface, making it easy to create detailed architecture diagrams without extensive training.
2. Pre-Built Templates
Cloudchart provides a wide range of templates for AWS, Azure, and GCP, allowing users to start quickly and ensure accuracy.
3. Real-Time Collaboration
Teams can work together on diagrams simultaneously, ensuring everyone is aligned and contributing to the design process.
4. Standardized Symbols
Cloudchart includes standardized symbols and notations, ensuring diagrams are clear, consistent, and easy to understand.
5. Export Options
Cloudchart allows users to export diagrams as animated GIFs or SVGs, providing flexible options for sharing and presenting architecture diagrams.
Architecture diagrams are essential for understanding and managing complex software systems. They help teams collaborate and make better decisions. Cloudairy Cloudchart makes creating these diagrams easy and efficient. Whether you're working on AWS, Azure, or GCP, Cloudchart has the tools to help you create clear and informative architecture diagrams.
Start using Cloudairy to design diagrams, documents, and workflows instantly. Harness AI to brainstorm, plan, and build—all in one platform.
Table of Contents

Introduction
 Manage all your work in one placeCollaborate with your teamUse Cloudairy for FREE—forever


 Related Articles