Kubernetes
Understanding Kubernetes Architecture Diagrams and Components

AI Workspace for Diagrams & Collaboration
Get your team started in minutes
Sign up with your work email for seamless collaboration.
If you've ever tried to explain how Kubernetes works to someone or even to yourself you probably realized pretty quickly that a wall of text isn't going to cut it. Kubernetes (or k8s, as most people call it) is one of those technologies that only really clicks when you can see how the pieces fit together.
That's exactly what this guide is for. We'll walk through the entire Kubernetes architecture from top to bottom, break down every major component, and show you how to create clear, professional k8s architecture diagrams that actually make sense. Whether you're prepping for a CKA exam, planning a production deployment, or just trying to wrap your head around container orchestration, you're in the right place.
At its core, Kubernetes architecture is the design pattern that describes how a k8s cluster is organized. Think of it like the blueprint of a factory: you've got the management office (the control plane) making decisions about what gets built and where, and then you've got the factory floor (the worker nodes) where the actual work happens.
Every Kubernetes cluster follows this same fundamental split and understanding the core Kubernetes components is the first step to working with the platform effectively. The control plane handles all the big-picture decisions scheduling workloads, maintaining the desired state of your applications, responding to events like a pod crashing or a new deployment rolling out. The worker nodes are the machines that run your containers.
What makes the Kubernetes architecture so powerful is that it's designed to be self-healing and declarative. You tell the cluster what you want (say, "I need three replicas of this web server"), and k8s figures out how to make it happen. If a node goes down, the control plane automatically reschedules those pods somewhere else. You don't have to babysit it.
Here's the thing though: understanding this architecture isn't just an academic exercise. If you're running workloads in production, knowing how these Kubernetes components interact helps you debug faster, design more resilient systems, and have much better conversations with your platform team. And if you're building cloud architecture diagrams, understanding the k8s layer is non-negotiable.
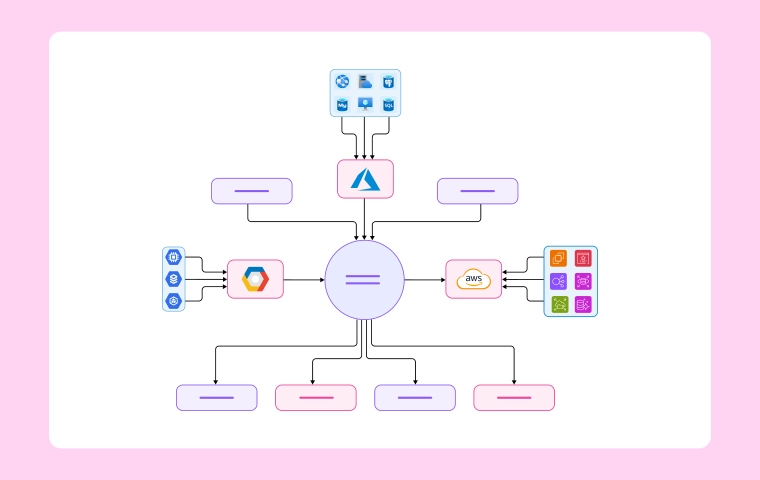
A good Kubernetes architecture diagram does more than look pretty on a slide deck. It gives everyone on the team from junior devs to senior architects a shared mental model of how the cluster works. And honestly, once you've seen a well-labeled k8s cluster diagram, the whole system makes way more sense than any documentation page ever could.
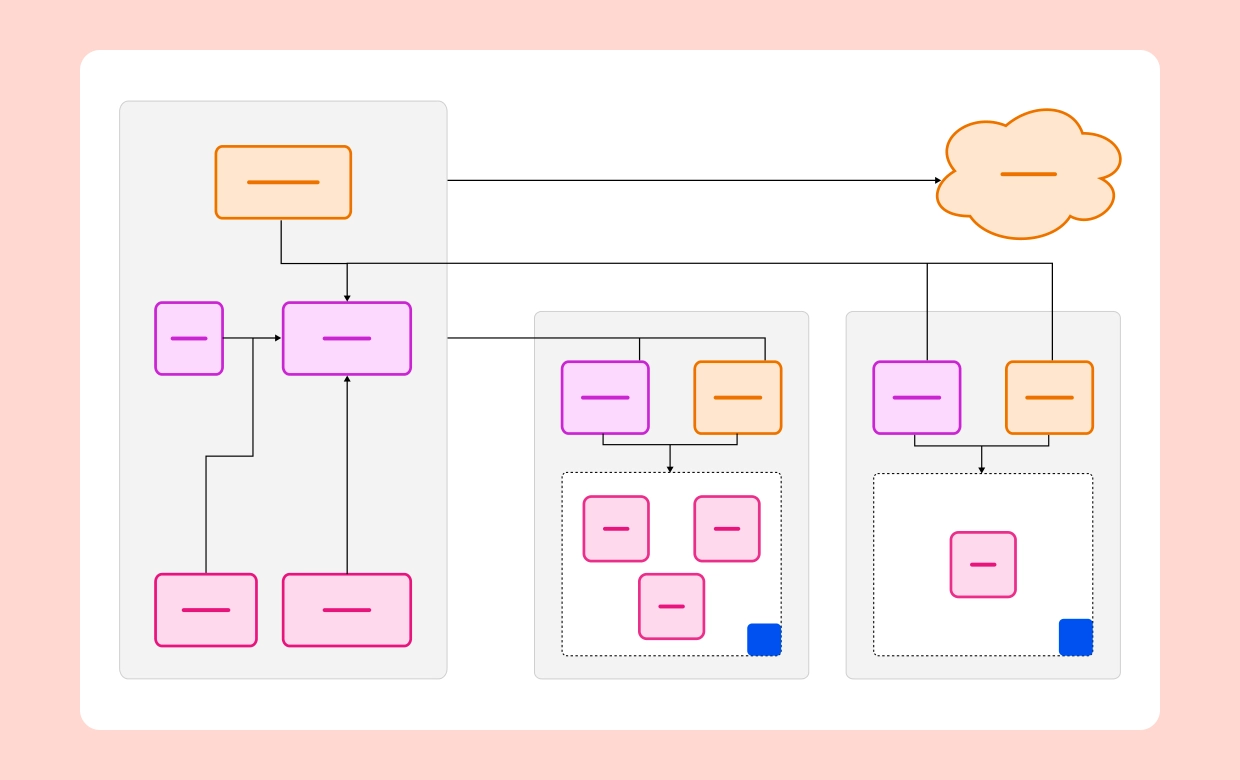
Here's what a complete Kubernetes cluster diagram typically includes:
The key to a useful Kubernetes architecture diagram is labeling everything clearly. Don't assume the reader knows what that little box in the corner represents. Name every component, show the communication arrows, and if possible, use color coding to distinguish the control plane from the data plane.
If you want to skip the blank-canvas anxiety, Cloudairy has pre-built Kubernetes architecture diagram templates that you can customize to match your actual setup. Just drag, drop, and relabel.
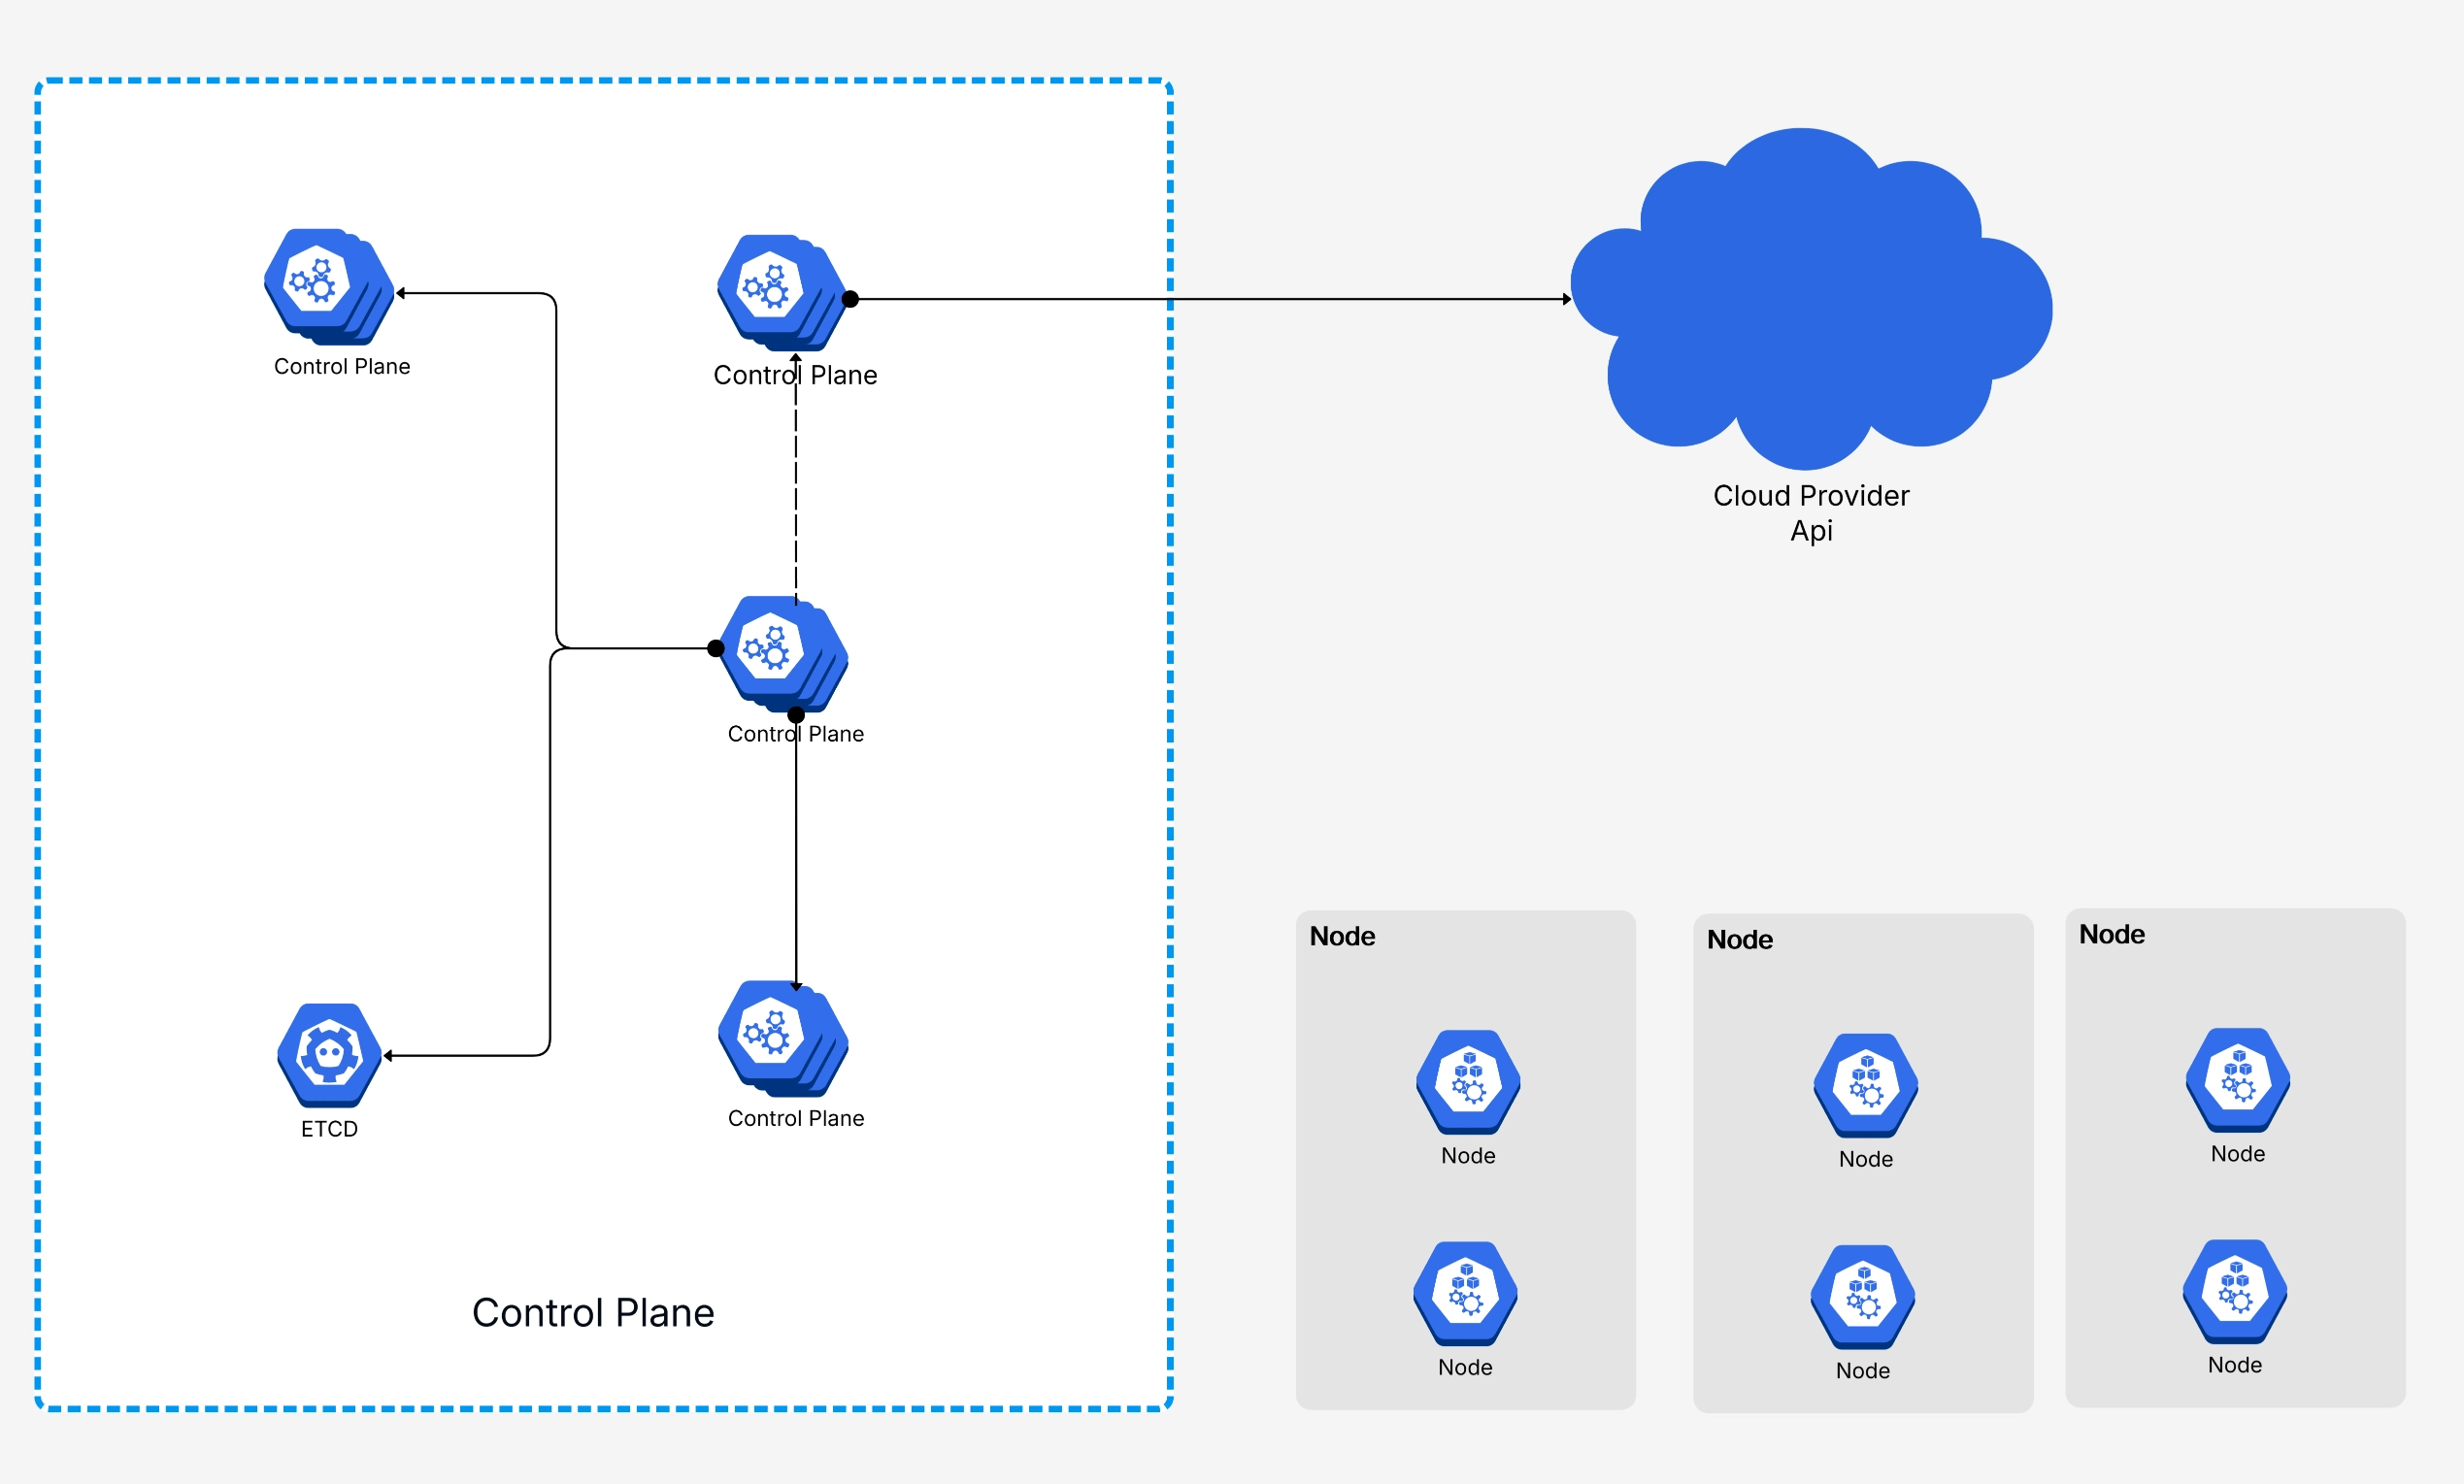
The control plane is where all the decision-making happens in a Kubernetes cluster. It doesn't run your application workloads (in most setups, at least) instead, it watches the state of the entire cluster and takes action to make reality match your desired configuration.
Let's break down each component. If you've ever wondered what's actually happening behind the scenes when you run
kubectl apply, this is where the magic lives.
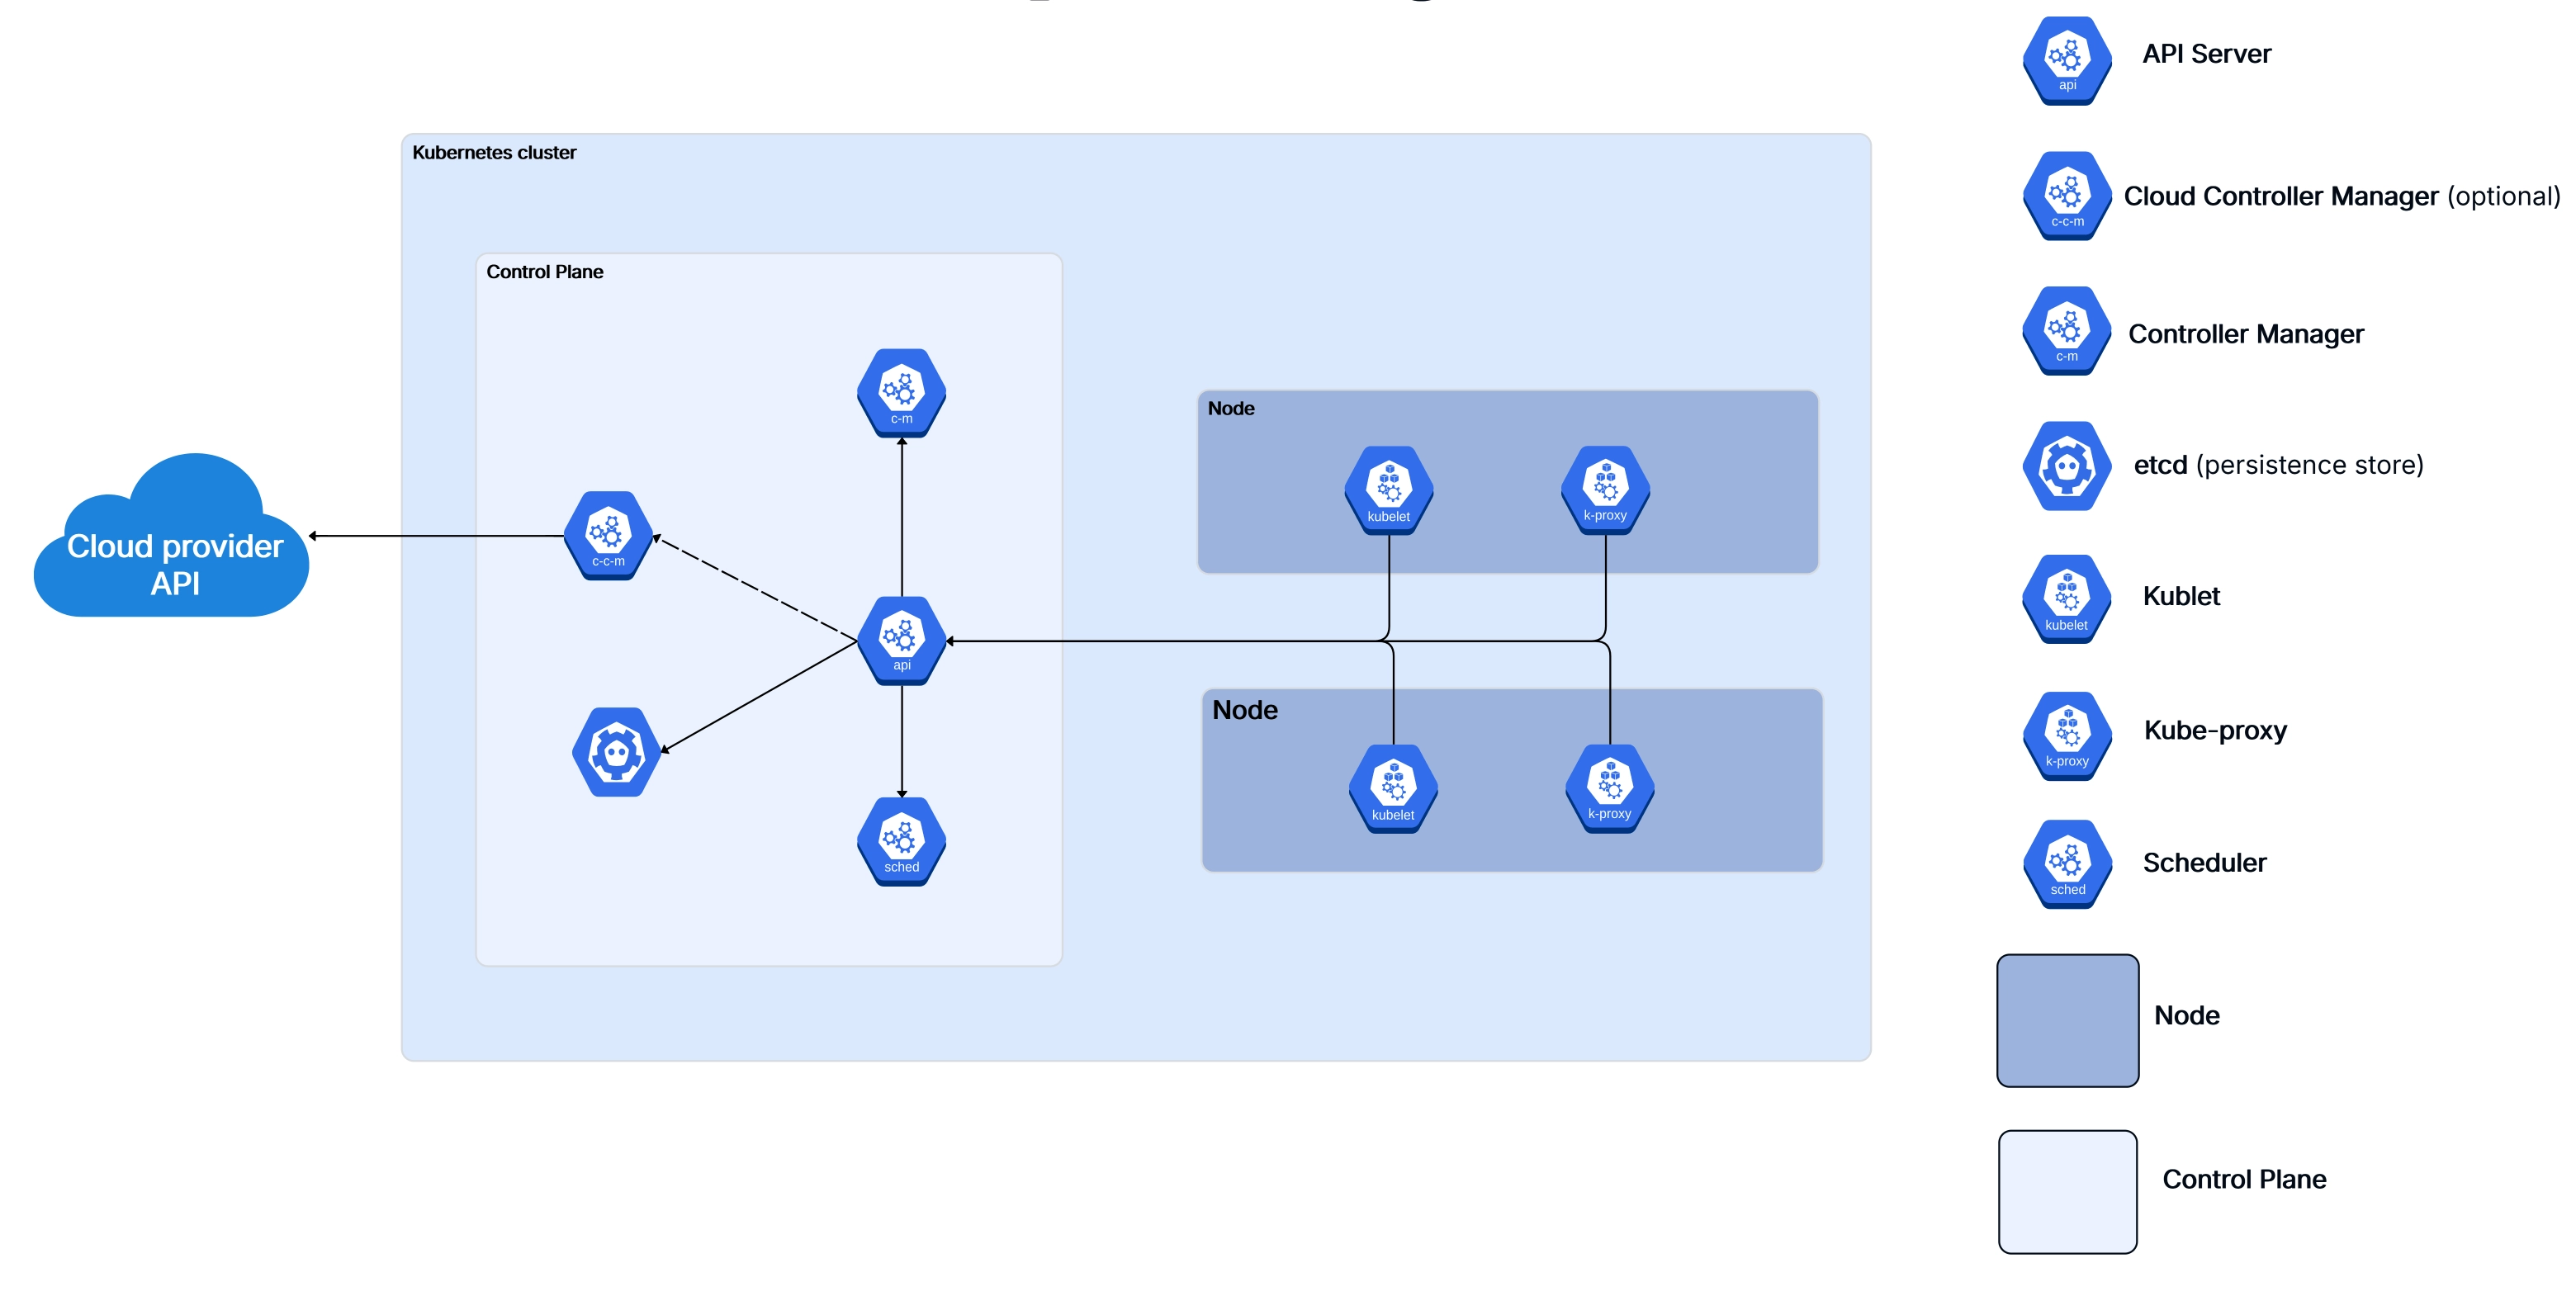
The API Server is the front door of the Kubernetes control plane. Every interaction with the cluster — whether it
comes from kubectl, a CI/CD pipeline, or another internal component — goes through the API Server
first. It validates requests, authenticates the caller, and then writes the desired state to etcd.
Think of it as the receptionist at a busy office: nothing happens without going through them first. The API Server exposes a RESTful API and supports admission controllers that can intercept and modify requests before they're persisted. This is where things like resource quotas, security policies, and webhook validations get enforced.
In production k8s clusters, the API Server is usually run as multiple replicas behind a load balancer for high availability. If the API Server goes down, you can't interact with the cluster — though running workloads will continue operating because worker nodes are semi-autonomous.
etcd is a distributed key-value store, and it's the single source of truth for your entire Kubernetes cluster. Every piece of cluster state — deployments, services, config maps, secrets, node status — all lives in etcd.
This is probably the most critical component in the whole architecture. If you lose etcd and don't have backups, you've essentially lost your cluster configuration. That's why production setups always run etcd as a multi-node cluster (typically 3 or 5 nodes for quorum) and implement regular snapshot backups.
One important thing to understand: only the API Server talks directly to etcd. Other control plane components don't read or write to etcd directly — they go through the API Server. This design keeps things clean and ensures consistent access control.
When you create a new pod, it doesn't just magically appear on a node. The Scheduler watches for newly created pods that don't have a node assignment yet, evaluates which nodes are eligible, scores them based on various factors, and then binds the pod to the best available node.
The scoring process considers things like available CPU and memory, affinity and anti-affinity rules, taints and tolerations, data locality, and custom scheduling policies you might have configured. It's surprisingly sophisticated — and if you're doing anything non-trivial with k8s, understanding how the scheduler thinks will save you hours of debugging weird placement decisions.
The Controller Manager runs a bunch of control loops (called "controllers") that continuously watch the cluster state and take action to move the current state toward the desired state. Some of the key controllers include:
Each controller follows the same pattern: watch, compare, act. It watches the current state, compares it to the desired state stored in etcd (via the API Server), and takes corrective action if there's a mismatch. This is the heart of Kubernetes' self-healing capability.
If you're running Kubernetes on a cloud provider like AWS, Azure, or GCP, the Cloud Controller Manager is what bridges the gap between k8s and the cloud platform's APIs. It handles things like provisioning load balancers, managing cloud-specific storage volumes, and updating node information with cloud metadata.
This component was split out from the main Controller Manager to make Kubernetes more modular. It means cloud providers can ship their own integration code without modifying the core k8s codebase. If you're working with cloud infrastructure, our AWS architecture diagram guide covers how these cloud-specific components fit into the bigger picture.
While the control plane is busy making decisions, worker nodes are where the actual work gets done. Every container you deploy runs on a worker node, and each node has a specific set of components that keep things running smoothly.
In a typical production cluster, you'll have anywhere from a handful to hundreds of worker nodes, depending on your scale. Each node is either a physical machine or a virtual machine, and they all report back to the control plane.
.webp)
The Kubelet is the primary agent that runs on every worker node. It's responsible for making sure the containers described in a pod spec are actually running and healthy. The Kubelet gets its instructions from the API Server (either through watching for changes or through direct API calls) and then works with the container runtime to start, stop, and monitor containers.
It also handles health checks — both liveness probes (is the container alive?) and readiness probes (is it ready to receive traffic?). If a liveness check fails, the Kubelet restarts the container. If a readiness check fails, the pod gets removed from service endpoints until it recovers.
One thing that catches people off guard: the Kubelet doesn't manage containers that weren't created by Kubernetes. It only cares about pods and their containers.
Kube-proxy runs on every node and maintains the network rules that allow pods to communicate with each other and with the outside world. When you create a Kubernetes Service, kube-proxy is what makes the magic happen — it updates iptables rules (or IPVS rules, depending on your configuration) so that traffic to the service's virtual IP gets forwarded to the right set of pods.
In modern k8s clusters, IPVS mode is generally preferred over iptables for better performance at scale. If you've got thousands of services, iptables rules can get slow to update. IPVS uses hash-based lookups and handles large rule sets much more efficiently.
The container runtime is what actually runs your containers. Kubernetes supports any runtime that implements the Container Runtime Interface (CRI). The most common options are:
The runtime pulls images, creates containers, manages their lifecycle, and reports status back to the Kubelet. It's the lowest level of the k8s stack that you'll typically interact with.
Pods are the smallest deployable unit in Kubernetes — and honestly, they're where the rubber meets the road. Everything else in the k8s architecture exists to support running pods.
A pod wraps one or more containers that share the same network namespace (meaning they share an IP address and can talk to each other over localhost) and can share storage volumes. Most of the time, a pod runs a single container. But multi-container pods are common for patterns like sidecars, init containers, and ambassadors.
.webp)
Every pod goes through a predictable lifecycle:
While single-container pods are the norm, Kubernetes supports several multi-container patterns that are genuinely useful in production:
Understanding pod architecture is essential if you're diagramming k8s deployments. Each pod boundary, the containers inside it, and the shared resources between them all need to be represented clearly in your architecture diagrams.
.webp)
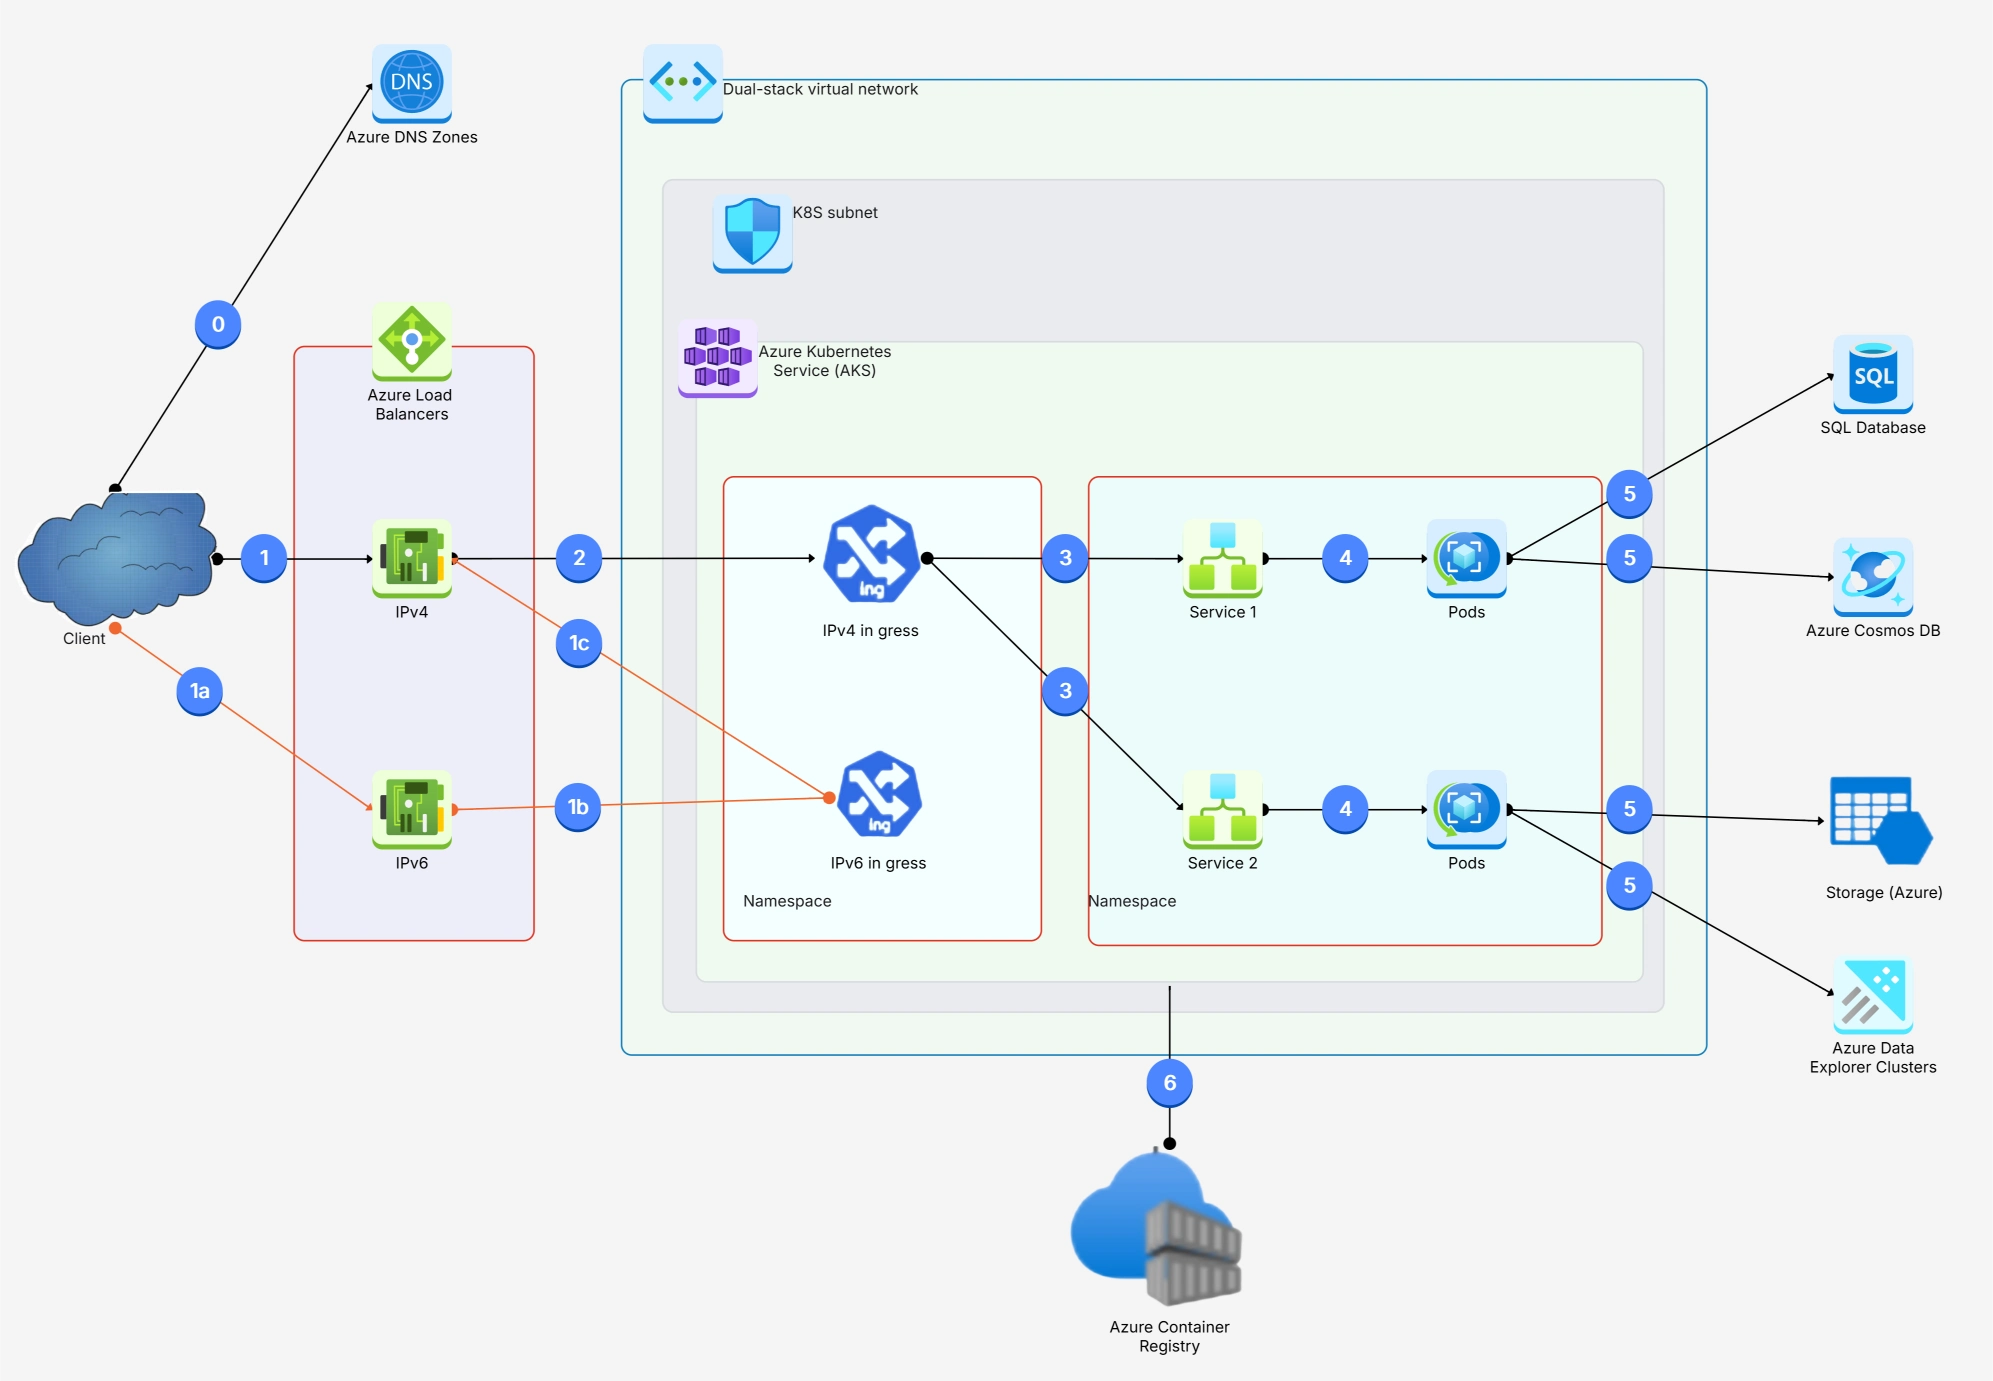
Networking in Kubernetes can feel intimidating at first, but the core model is actually pretty elegant. Here's the fundamental rule: every pod gets its own IP address, and every pod can talk to every other pod without NAT. That's it. No port mapping gymnastics, no special routing configs. Flat networking.
This design simplifies things enormously compared to plain Docker networking where you'd be juggling port mappings and bridge networks. In k8s, containers behave pretty much like normal processes on a normal network.
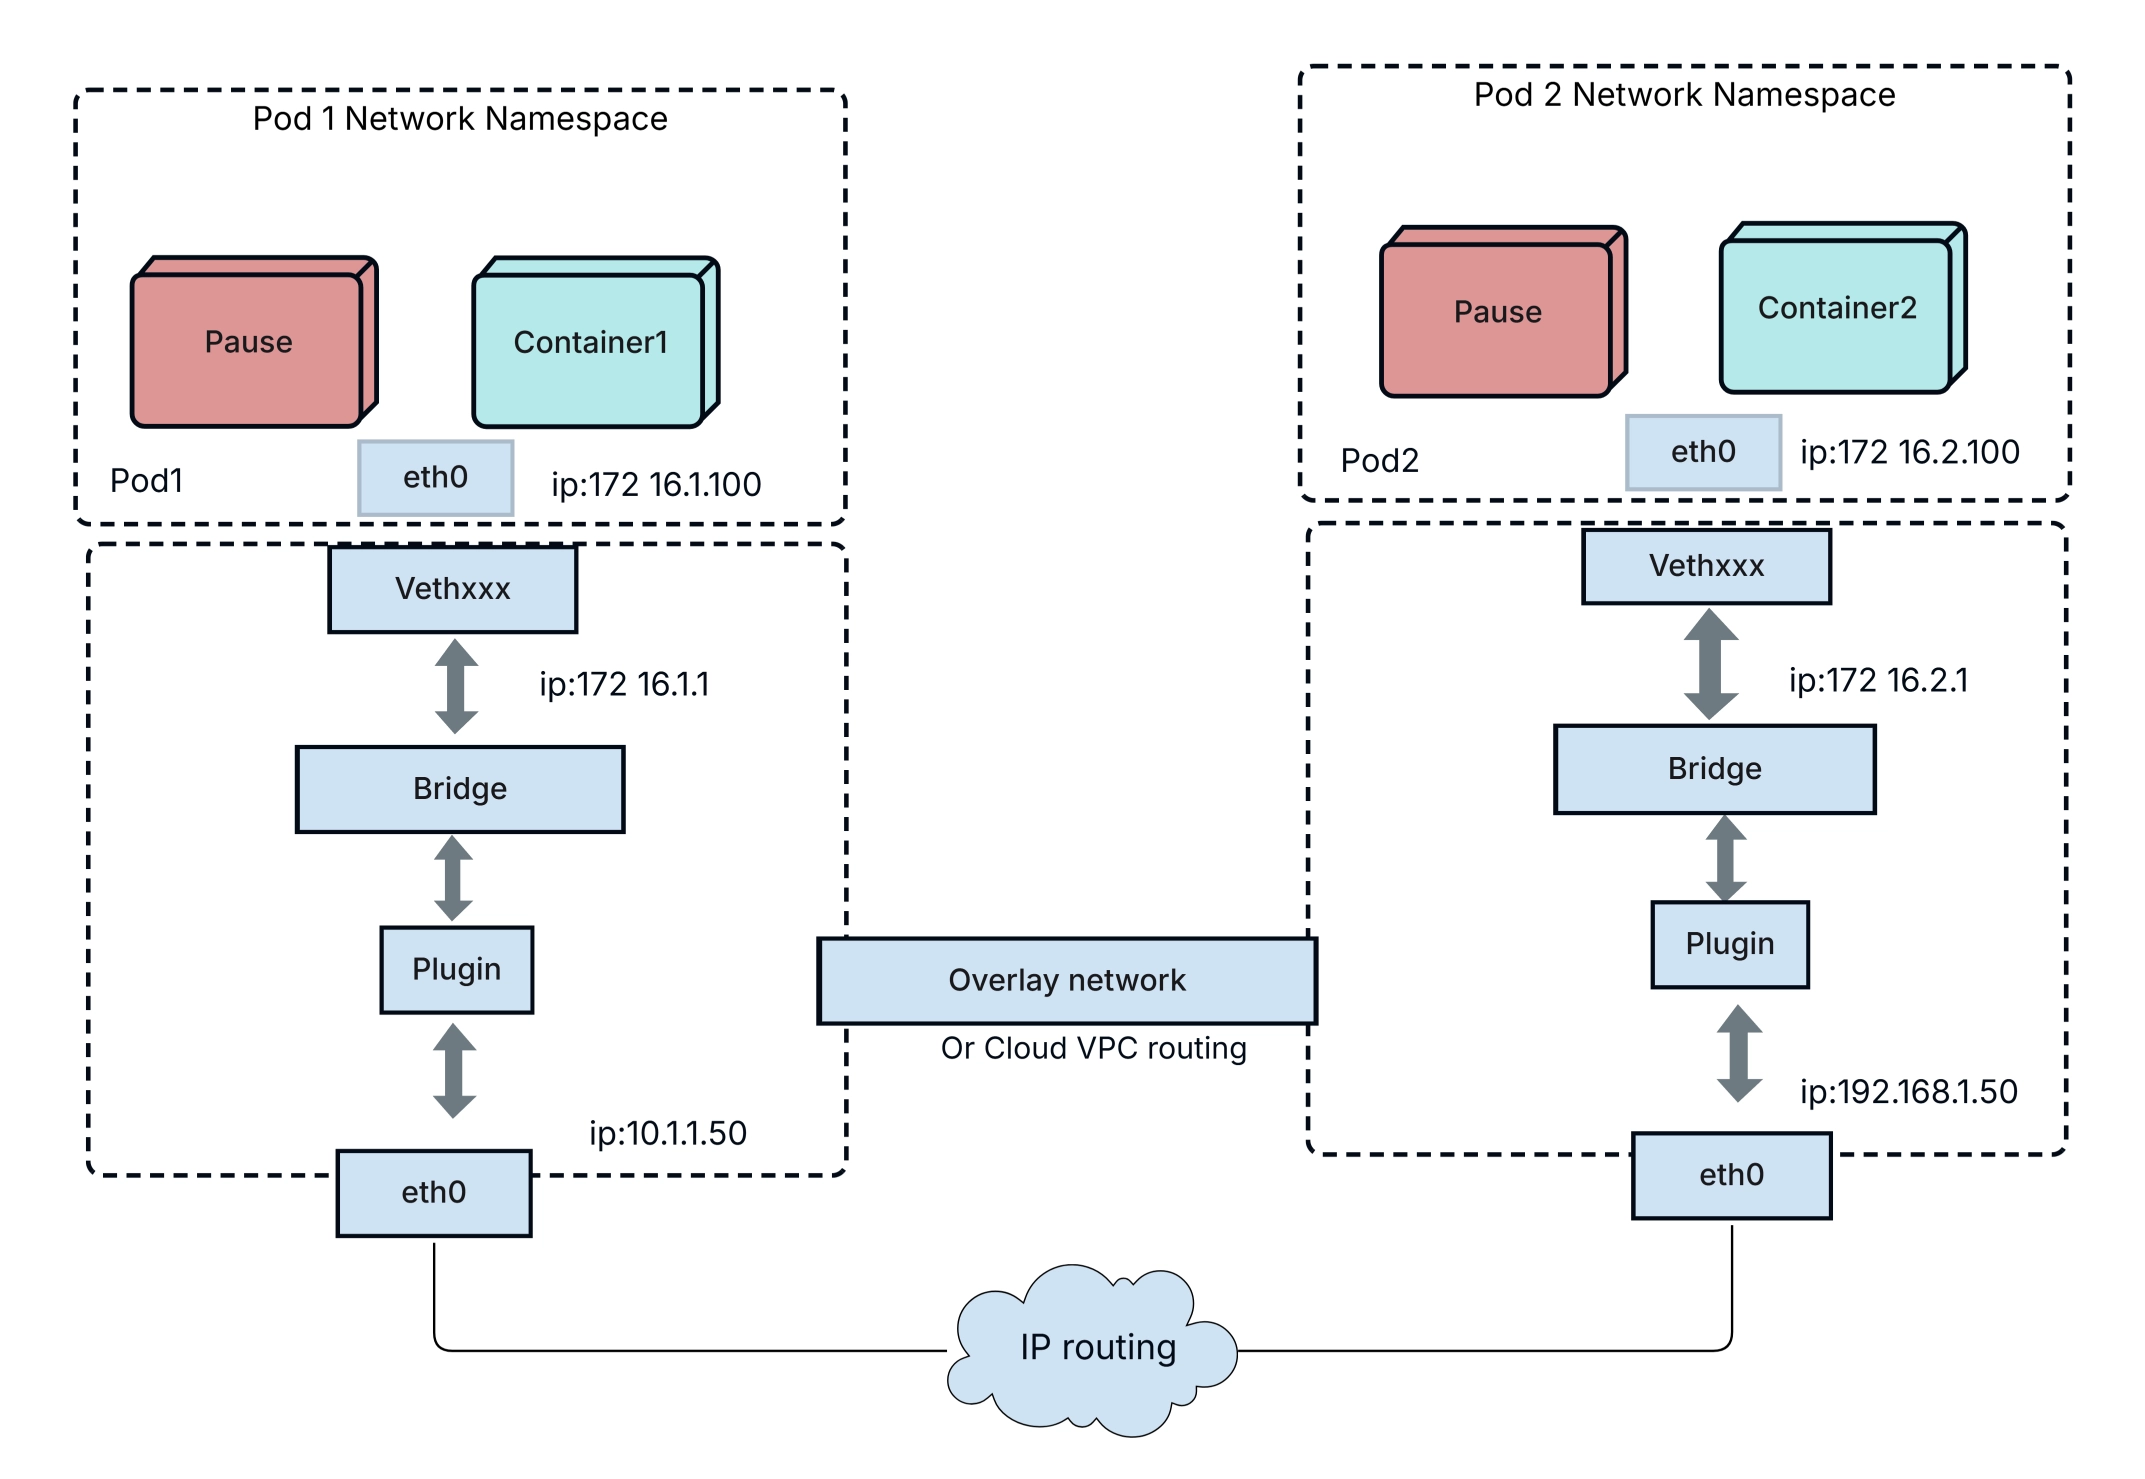
Pods on the same node communicate through a virtual ethernet bridge. Pods on different nodes communicate through a network overlay (like Calico, Flannel, Cilium, or Weave) that encapsulates packets and routes them across the underlying network. From the application's perspective, it doesn't matter whether the other pod is on the same machine or across the data center — the addressing works the same way.
Since pods are ephemeral and their IP addresses change every time they're recreated, Kubernetes Services provide a stable abstraction layer. A Service gets a persistent virtual IP (ClusterIP) and DNS name, and it load-balances traffic across the healthy pods that match its label selector.
There are several Service types you'll use:
While LoadBalancer services work fine for individual services, managing dozens of them gets expensive and messy. Ingress controllers solve this by providing a single entry point that routes traffic to different services based on URL paths or hostnames. Think of it as a reverse proxy that's Kubernetes-native.
Popular Ingress controllers include NGINX Ingress, Traefik, HAProxy, and cloud-specific options like AWS ALB Ingress Controller.
For a visual representation of how networking flows through your cluster, check out our network diagram tool — it's especially useful for mapping out traffic flow between services.
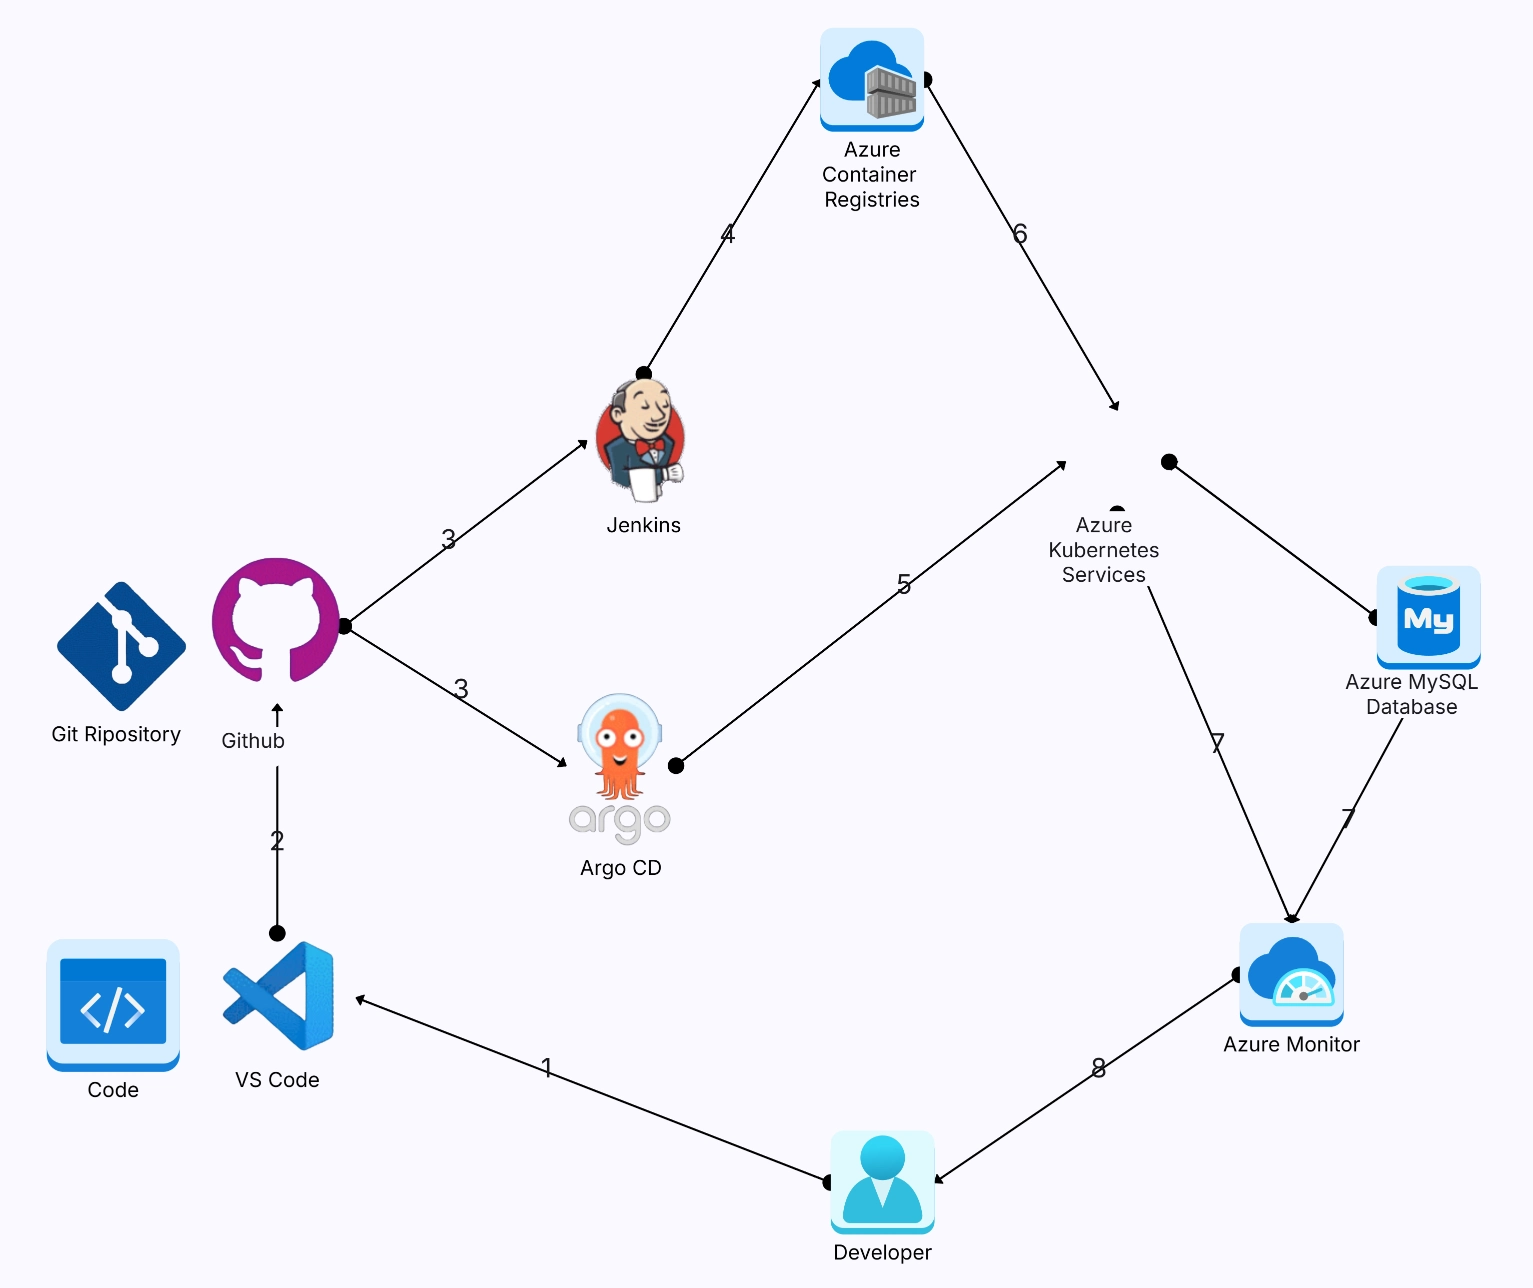
Kubernetes and microservices go together like bread and butter. In fact, the explosion of microservices adoption in the last decade is one of the main reasons Kubernetes became so popular in the first place. When you're running dozens (or hundreds) of small, independent services, you need an orchestration platform that can handle the complexity — and that's exactly what k8s was built for.
Each microservice gets deployed as its own set of pods, with its own scaling rules, resource limits, and deployment cadence. Kubernetes provides the primitives that make this manageable:
In a Kubernetes microservices architecture, services communicate using two main patterns:
Synchronous (request-response): Service A calls Service B and waits for a response. Typically implemented with REST APIs or gRPC. Simple and intuitive, but creates tight coupling and can cascade failures if Service B is slow or down.
Asynchronous (event-driven): Service A publishes an event to a message queue (like Kafka, RabbitMQ, or NATS), and Service B consumes it later. More resilient and decoupled, but adds complexity around message ordering and delivery guarantees.
Most production k8s microservices architectures use a mix of both — synchronous for real-time queries and asynchronous for workflows that can tolerate some delay.
As your microservices architecture grows, managing cross-cutting concerns like mutual TLS, traffic routing, retries, and observability gets painful. That's where a service mesh comes in.
Tools like Istio, Linkerd, and Cilium Service Mesh inject a sidecar proxy into each pod that handles all this infrastructure plumbing transparently. Your application code doesn't change — the mesh handles encryption, load balancing, circuit breaking, and distributed tracing at the network level.
If you're planning a microservices migration, our microservices architecture template gives you a solid starting point for diagramming your service boundaries and communication flows.
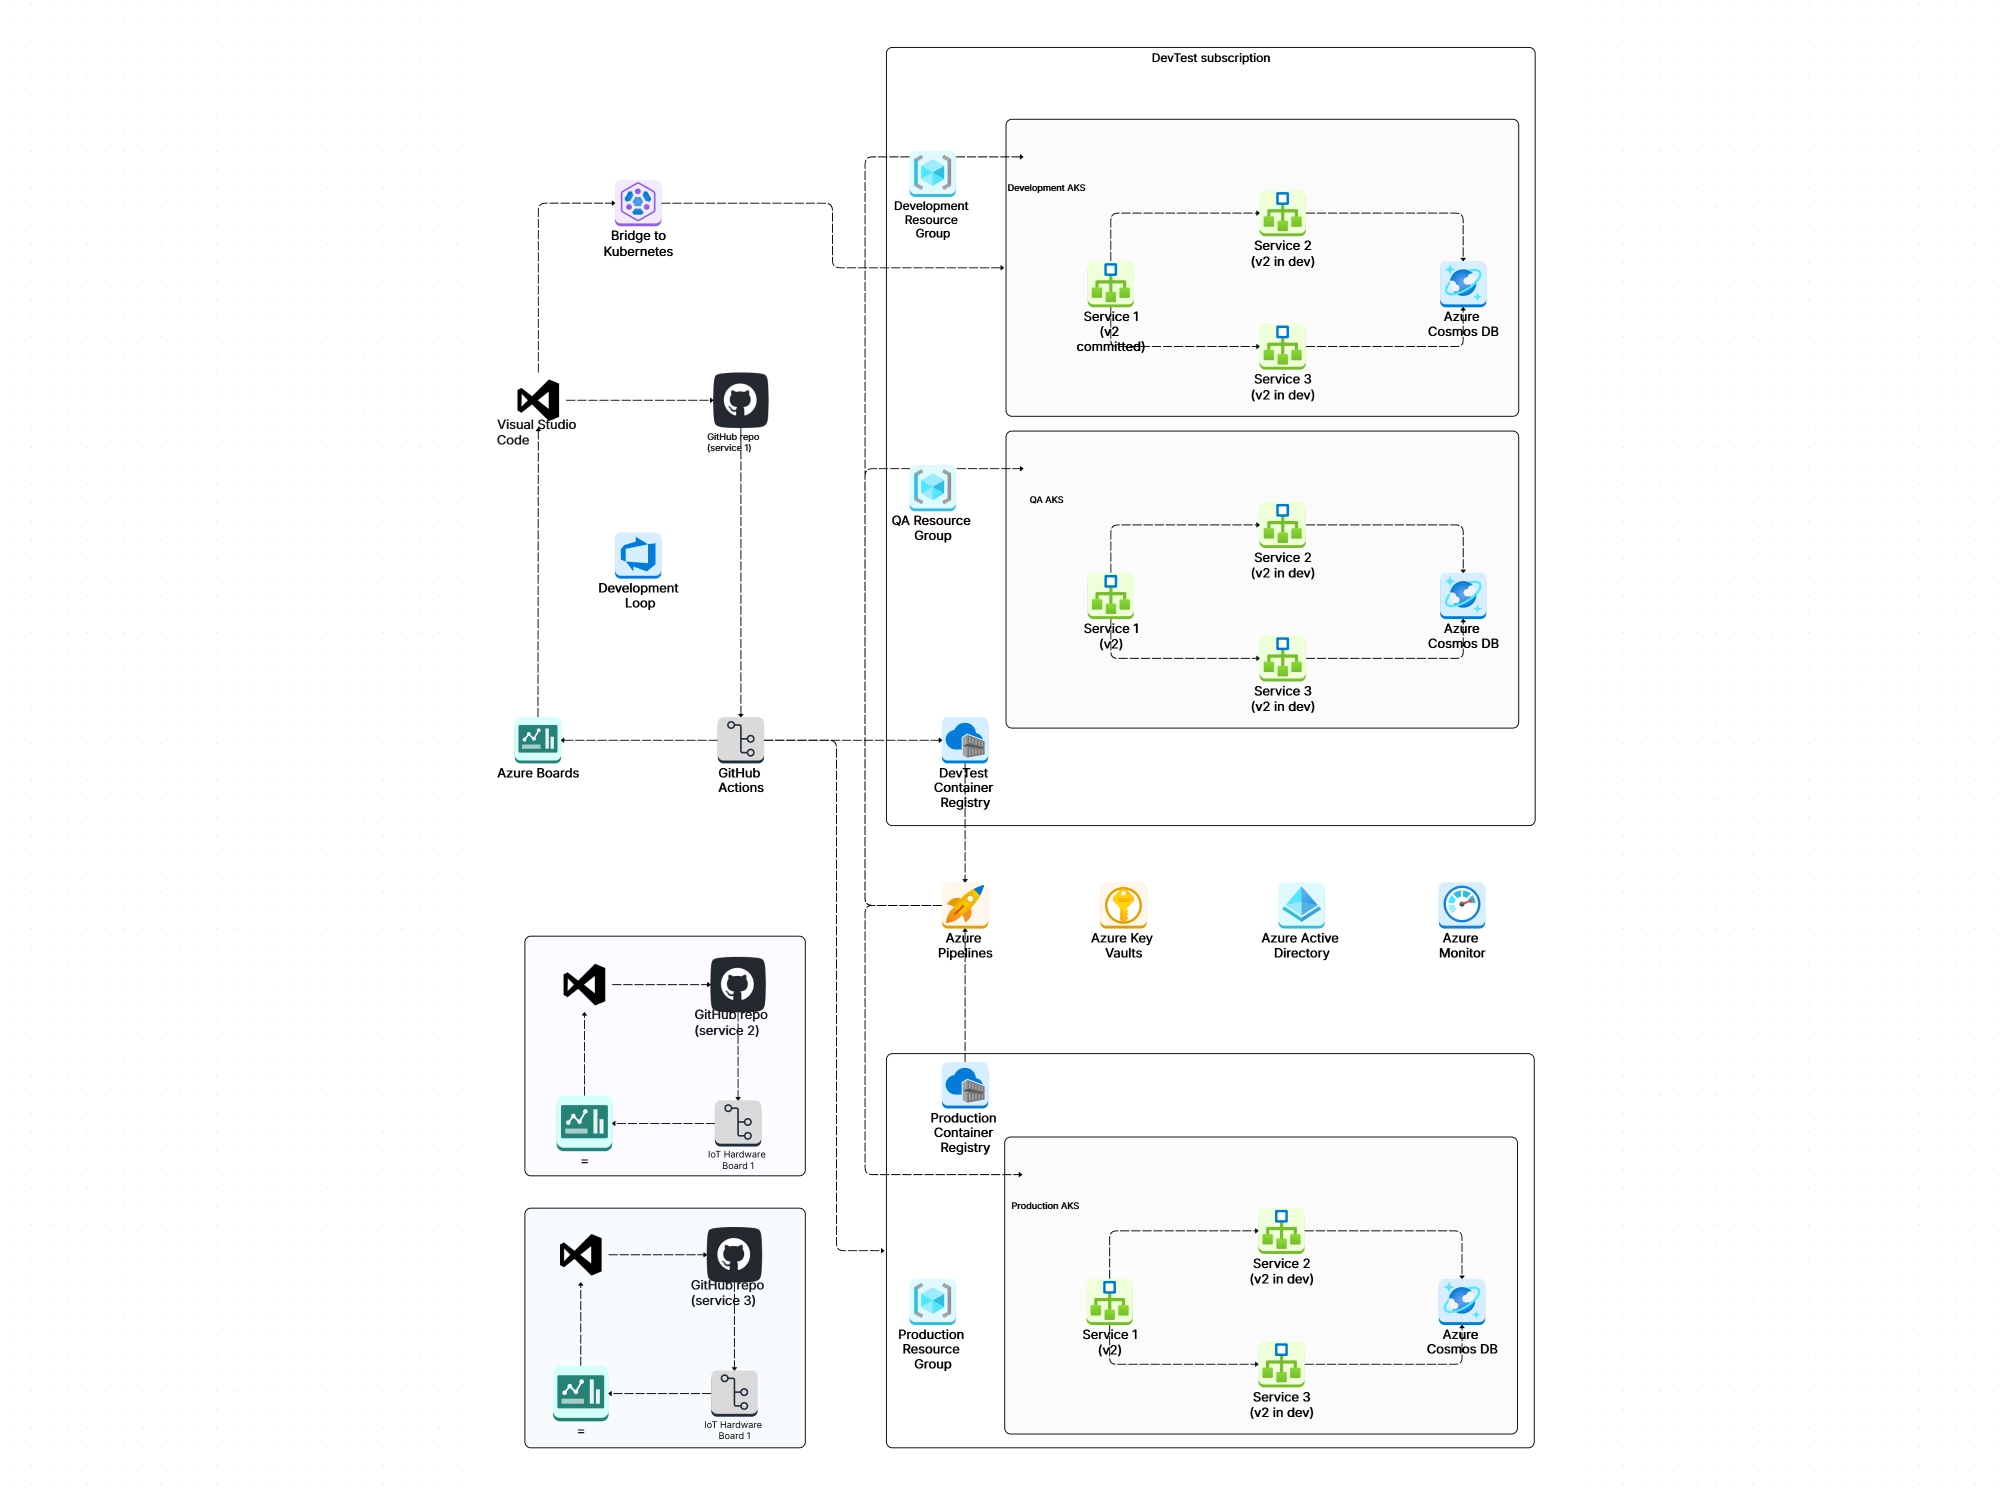
Getting your code running on k8s is one thing. A solid Kubernetes deployment strategy is what separates smooth releases from midnight fire drills. Getting it deployed safely — without dropping requests or breaking things — is another challenge entirely. Kubernetes supports several deployment strategies, and picking the right one matters a lot more than most people realize.
The default strategy in a Kubernetes Deployment. New pods are gradually created while old pods are gradually
terminated. You can control the pace with maxSurge (how many extra pods can exist during the update)
and maxUnavailable (how many pods can be offline during the update).
This works well for most stateless services. The rollout happens incrementally, and if something goes wrong, you can
run kubectl rollout undo to roll back to the previous version.
In a blue-green deployment, you run two identical environments — "blue" (current) and "green" (new). All traffic goes to blue. You deploy the new version to green, test it, and then switch traffic over by updating the Service selector. If anything goes wrong, you flip back to blue instantly.
The downside is that you need double the resources during the switch. But the upside is zero-downtime deployments with instant rollback. For critical services, the resource cost is worth it.
Canary deployments let you test a new version with a small percentage of real traffic before rolling it out to everyone. You deploy the new version alongside the old one and gradually shift traffic — maybe 5% at first, then 25%, then 50%, and finally 100% if everything looks good.
This is the safest approach for production services with large user bases. Tools like Argo Rollouts, Flagger, and Istio make canary deployments easier to manage in Kubernetes.
The simplest strategy: kill all old pods, then create new ones. This causes downtime, so it's only appropriate for development environments or workloads that can tolerate brief outages (like batch processing jobs).
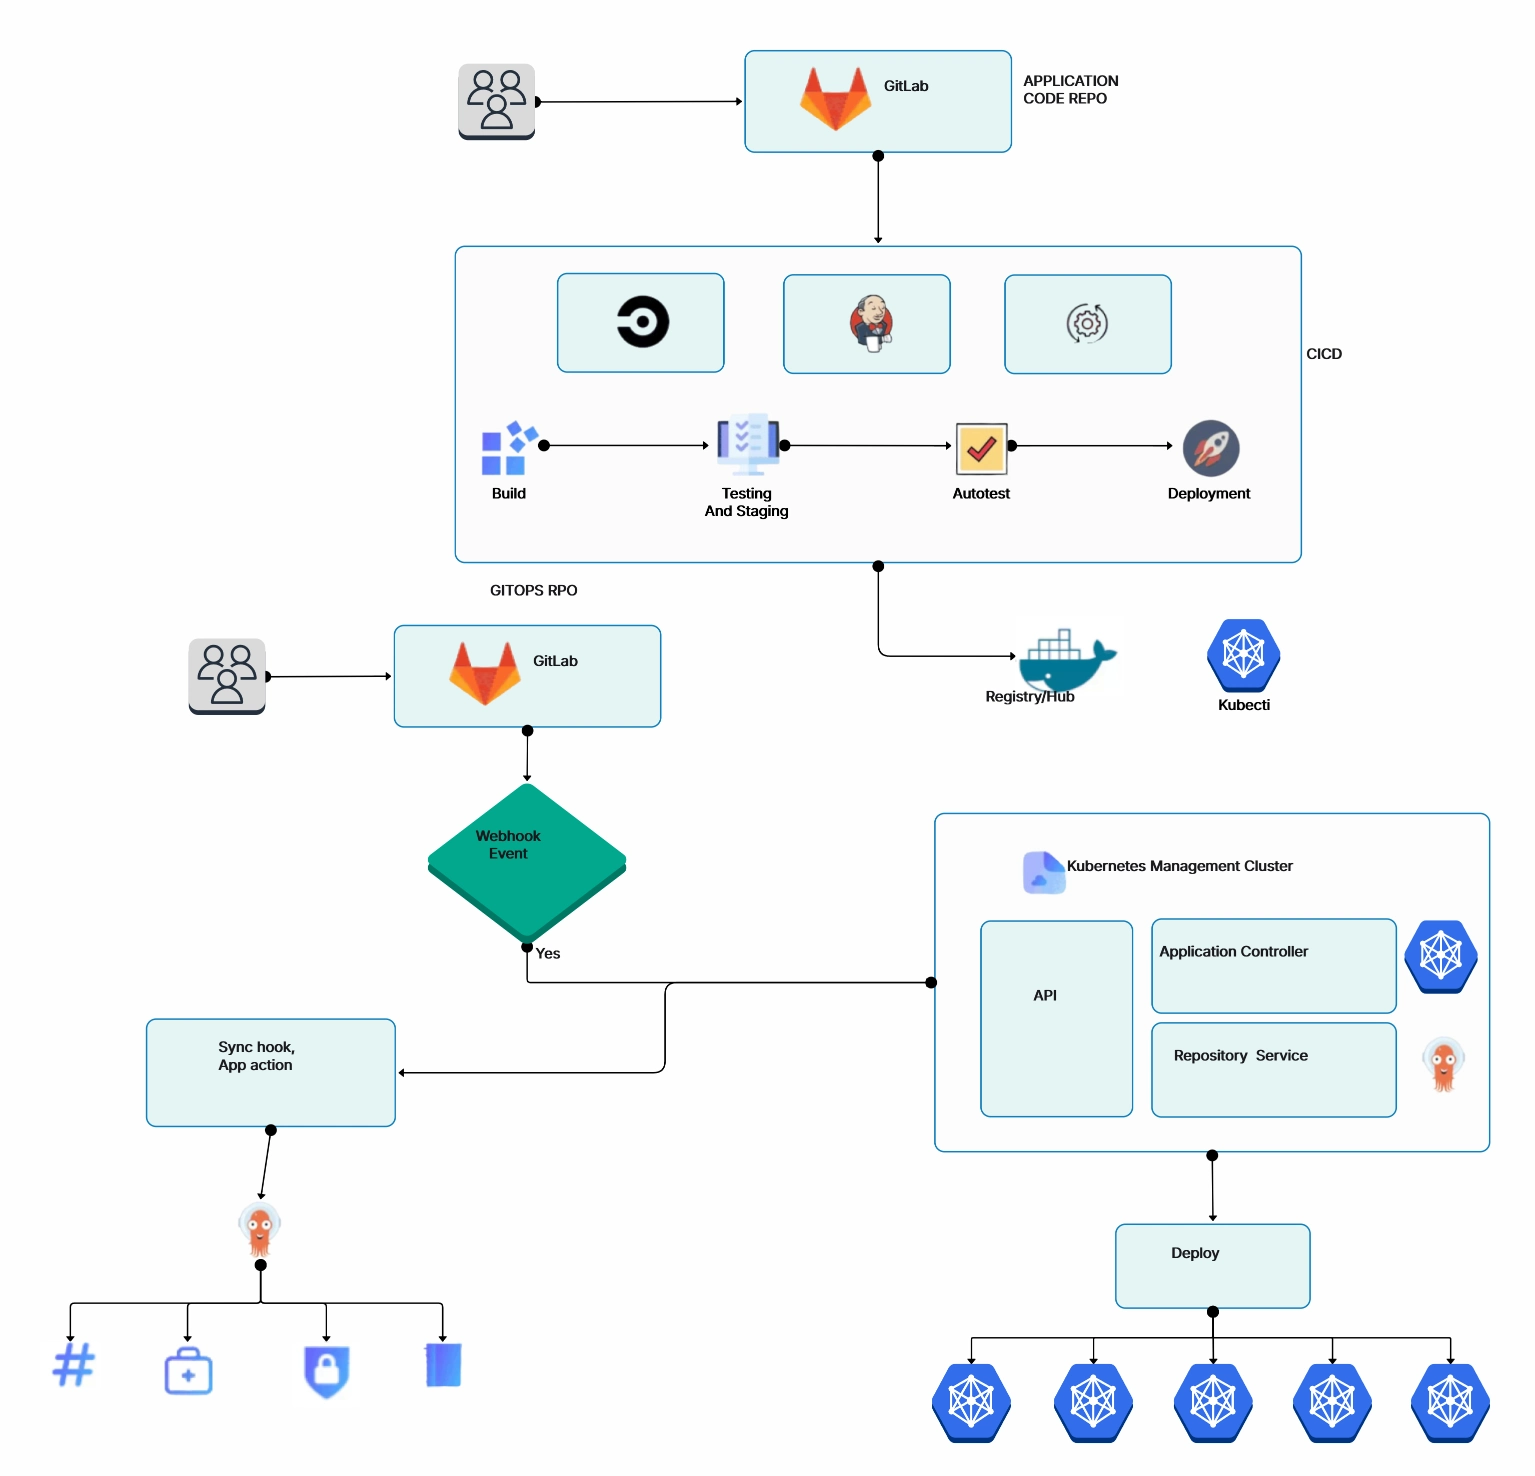
Mapping out your deployment flow with a flowchart can help your team visualize the rollout process and identify potential failure points before they hit production.
A well-made Kubernetes architecture diagram can save hours of back-and-forth conversations. It's one of those artifacts that pays for itself almost immediately — during architecture reviews, incident response, onboarding, and planning sessions.
Here's a practical approach to creating k8s diagrams that are actually useful:
Before you open any tool, decide what the diagram is for. A high-level cluster overview has different needs than a detailed networking diagram or a microservices interaction map. Don't try to cram everything into one diagram — it'll be unreadable.
Draw the cluster boundary first. Then add the control plane on one side and the worker nodes on the other. This immediately gives viewers the fundamental mental model of your k8s architecture.
Work from the top down: control plane components first, then node-level components, then pods and services, then networking and storage. This layered approach keeps the diagram organized and easy to follow.
Add arrows showing how components talk to each other. Label them with protocols (HTTPS, gRPC, TCP) where it matters. Highlight the critical paths — like how a user request flows from the Ingress through Services to the actual pods.
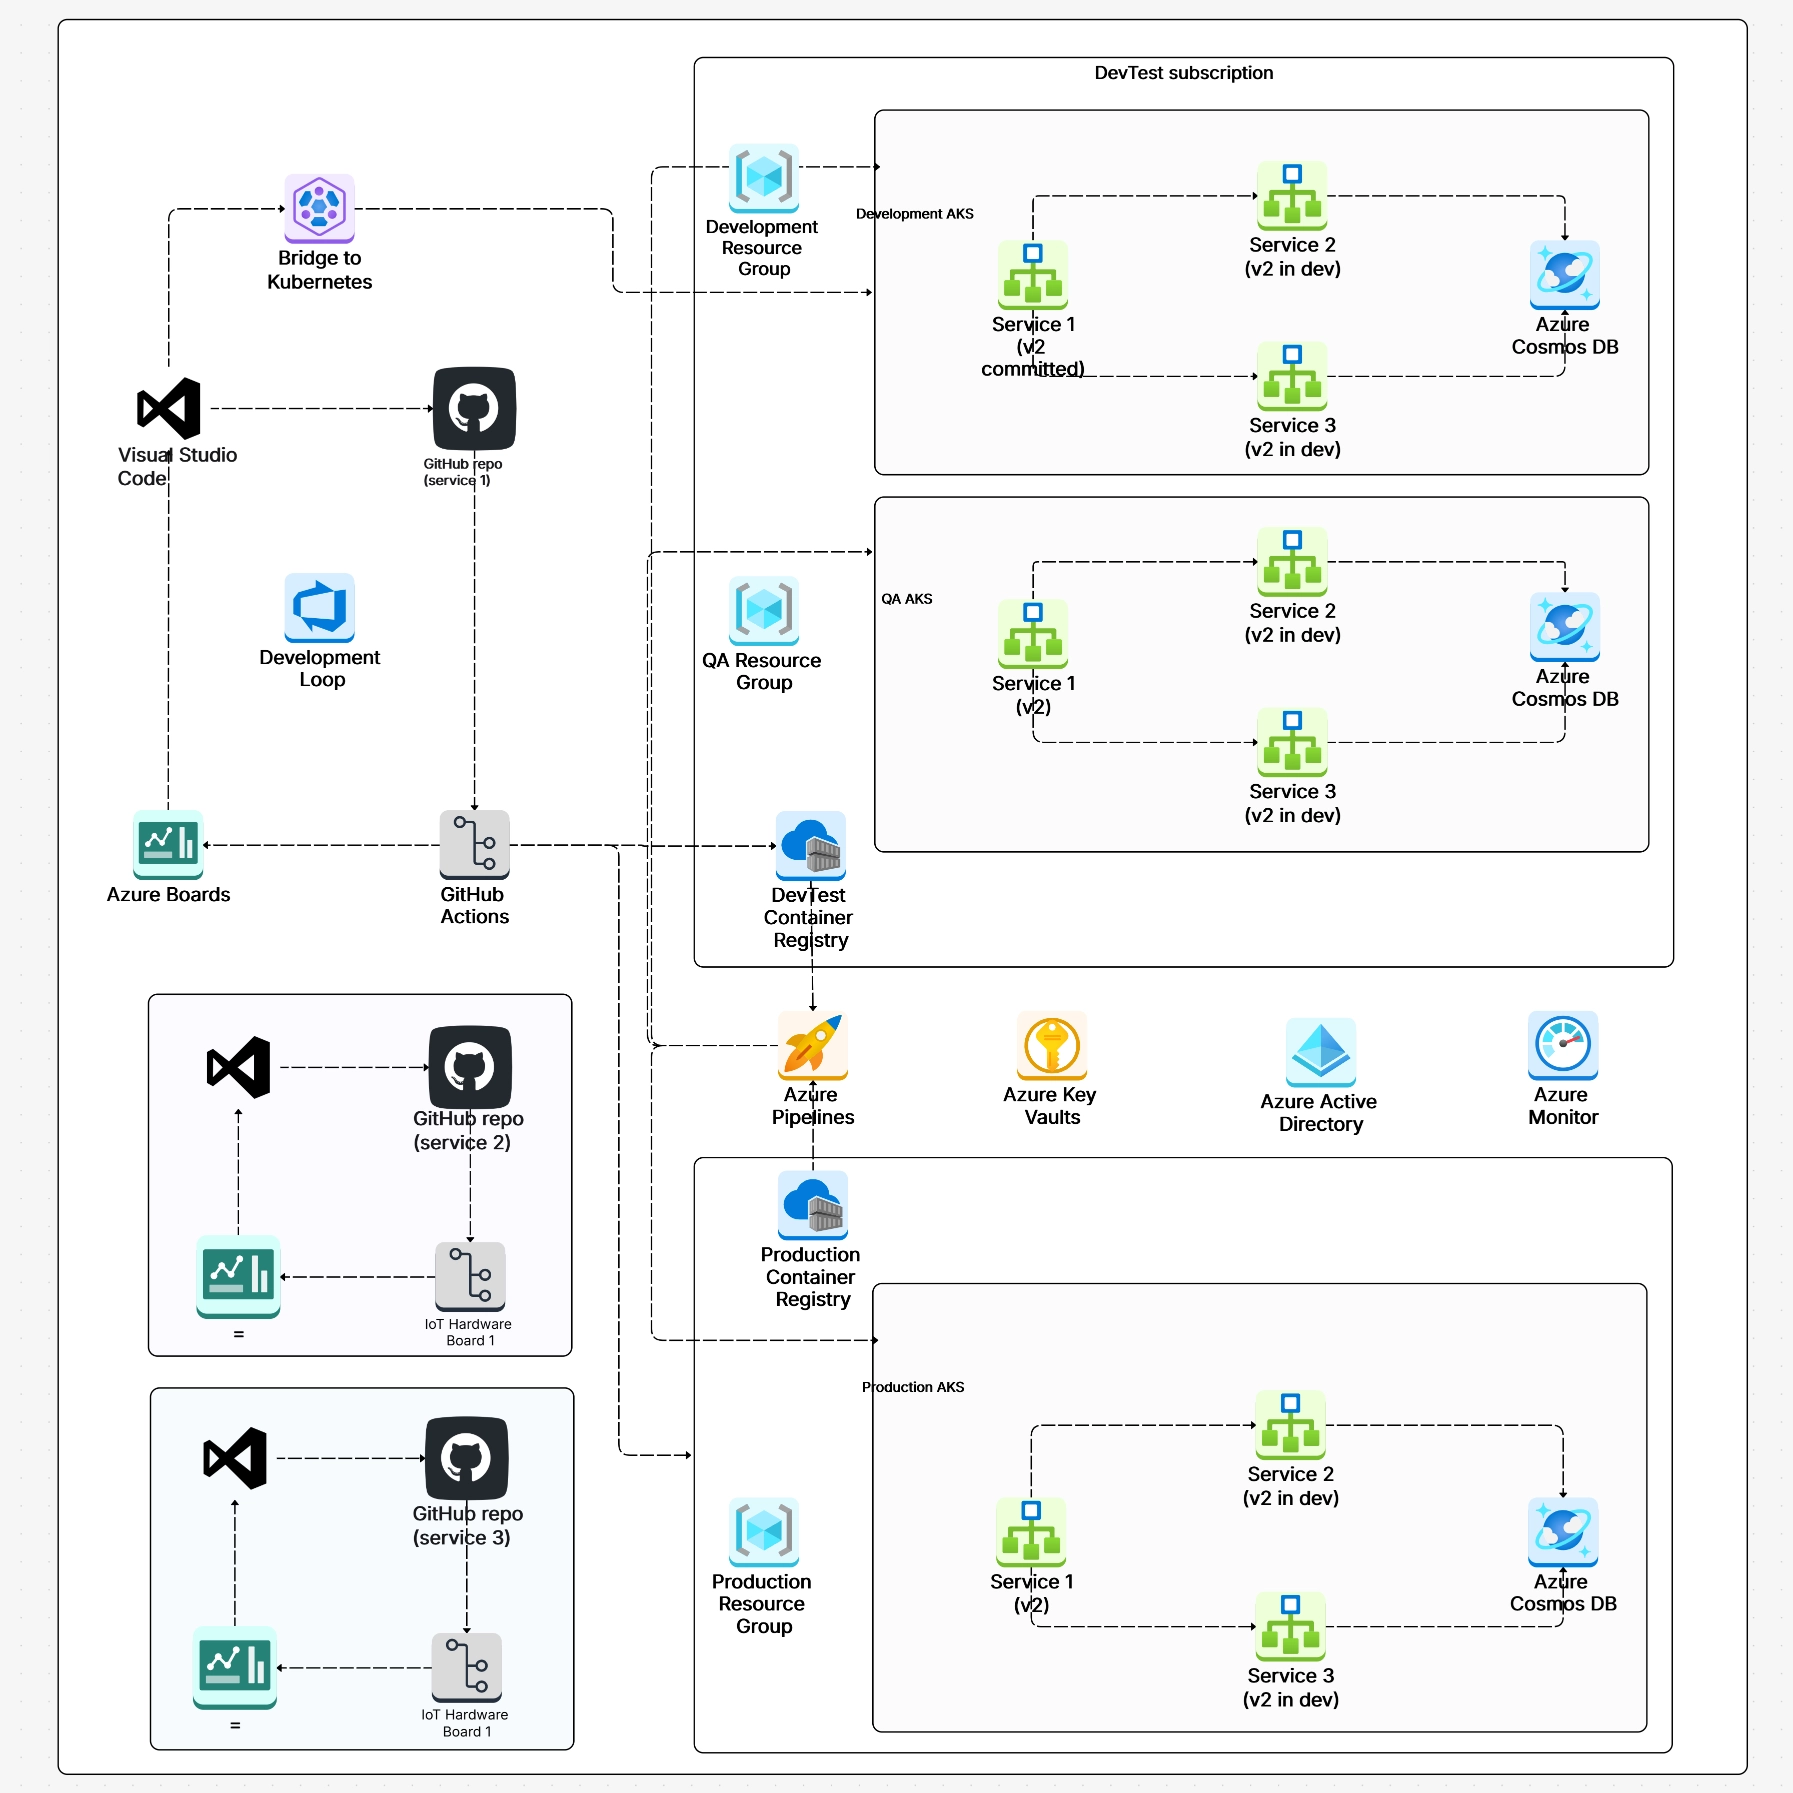
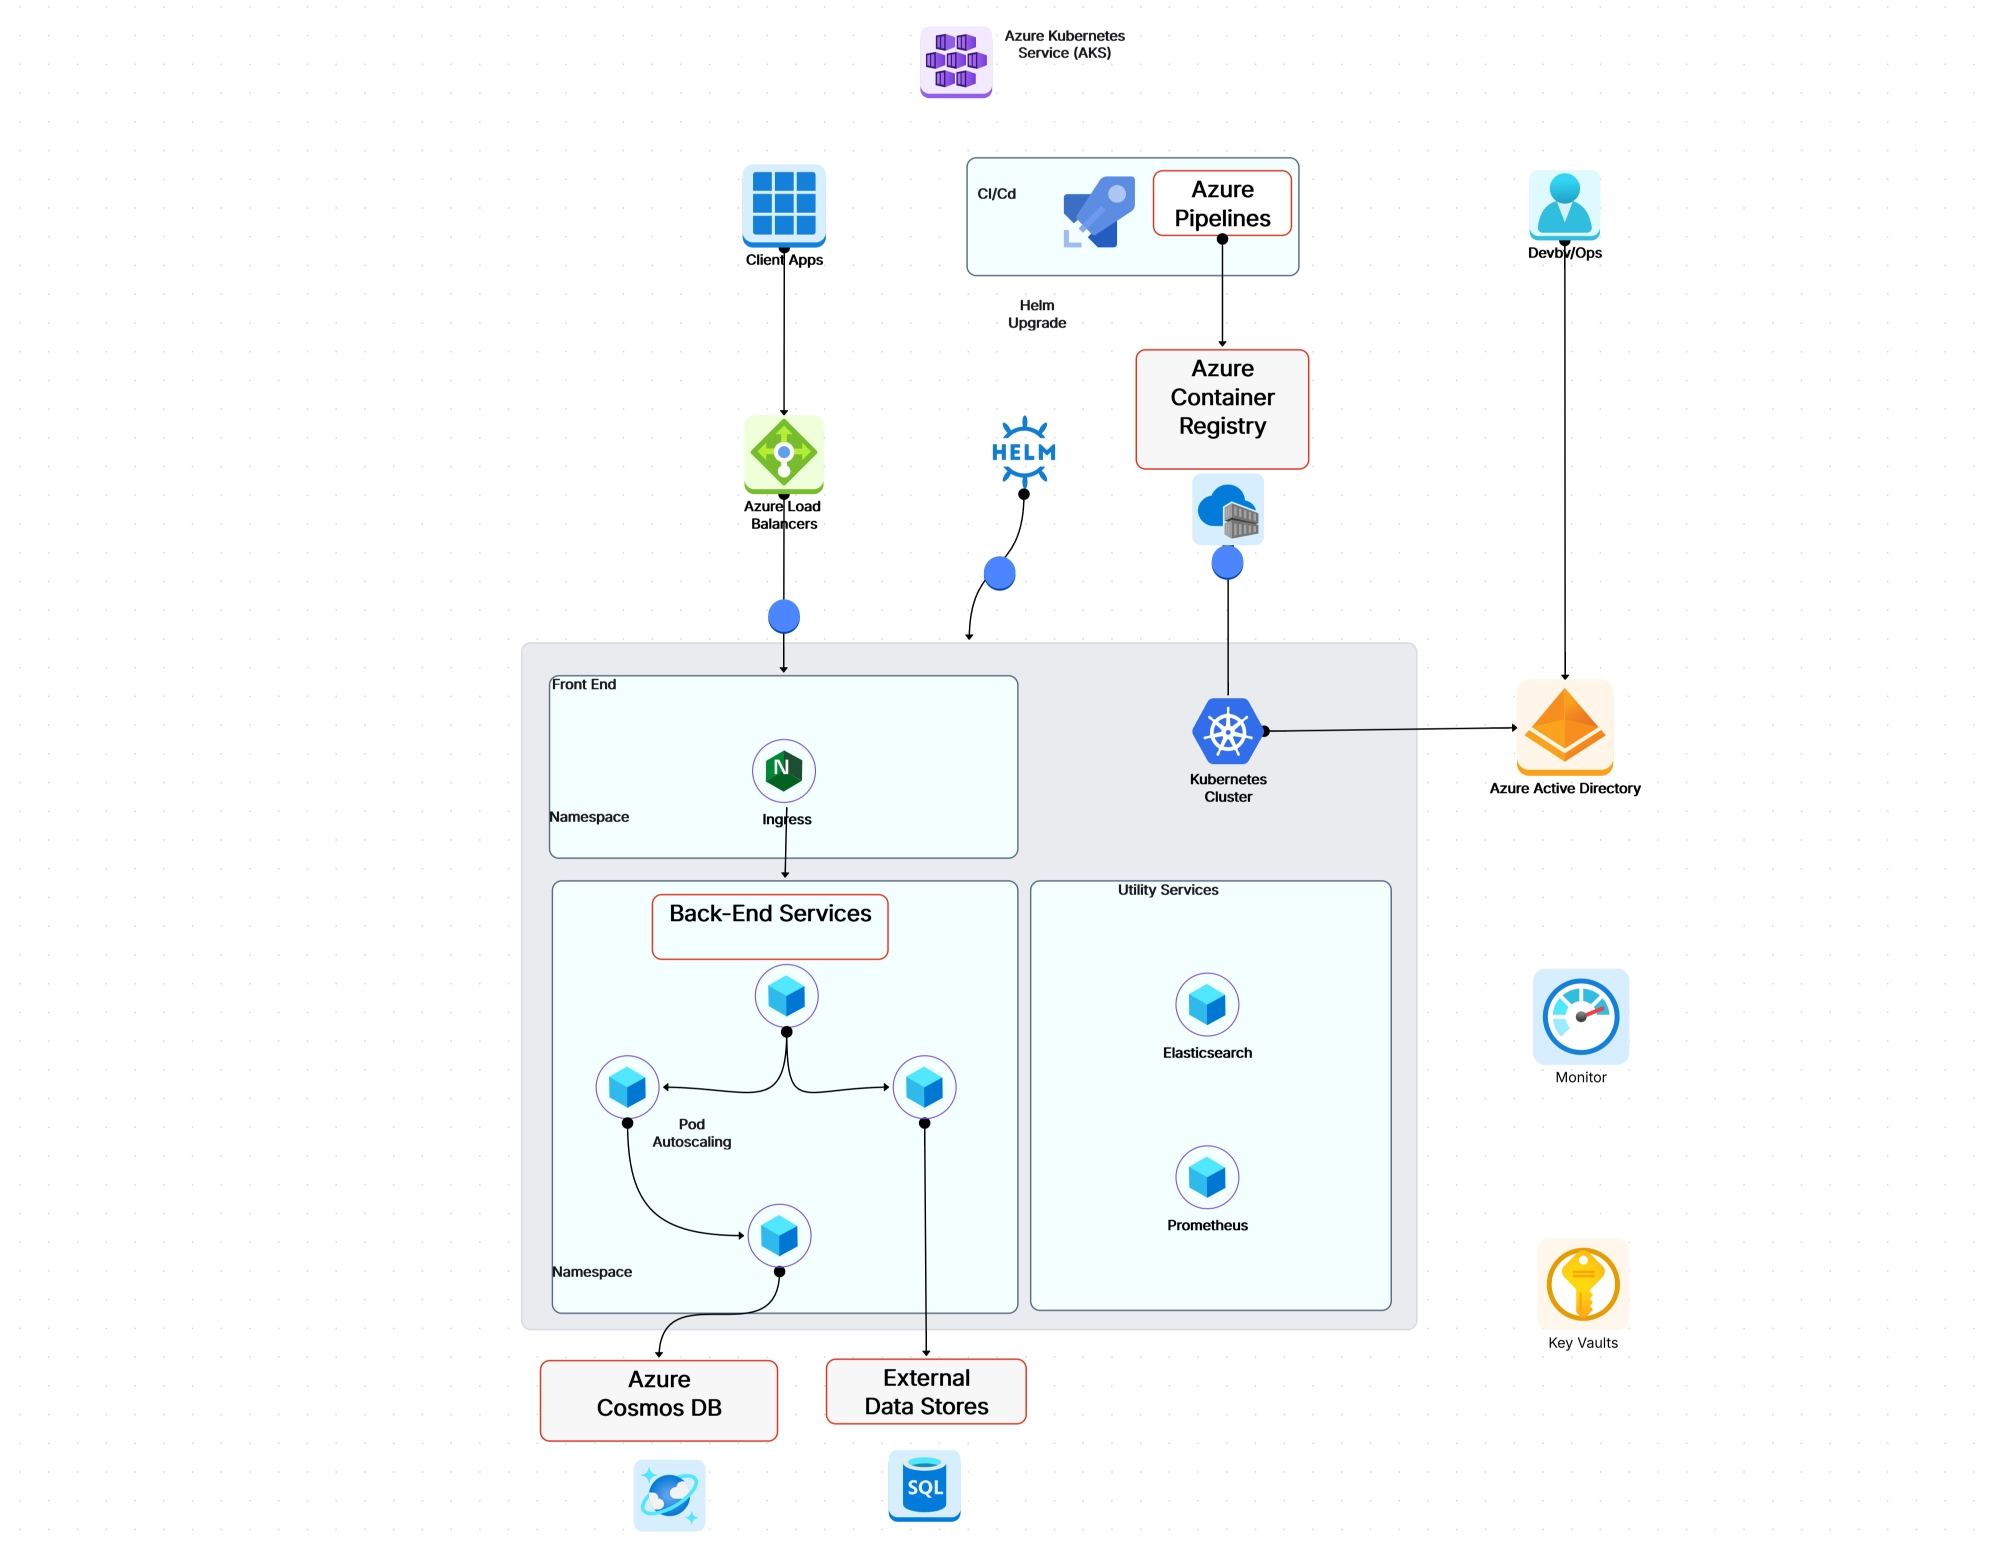
Cloudairy's AI cloud architecture generator is specifically designed for creating infrastructure diagrams like these. It comes with pre-built Kubernetes icons, Karpenter architecture templates, Azure AKS Baseline Architecture, and drag-and-drop components that follow standard diagramming conventions.
You can also start from scratch with our general-purpose diagram maker if you need something more custom. Either way, having dedicated cloud architecture symbols makes the output look professional and consistent.
After working with dozens of production k8s clusters, here are the architecture patterns and practices that consistently separate smooth operations from 3 AM pager alerts:
And one more that's often overlooked: document your architecture. Seriously. A living architecture diagram that reflects your actual cluster topology is worth its weight in gold. Cloud architecture diagram aren't just for presentations — they're operational tools that help teams respond to incidents faster and onboard new engineers in days instead of weeks.
What are the main components of Kubernetes architecture?
What is the difference between the control plane and worker nodes?
How does Kubernetes networking work?
What is a Kubernetes cluster diagram?
How many nodes can a Kubernetes cluster have?
What is the role of etcd in Kubernetes?
How do you create a Kubernetes architecture diagram?
Start using Cloudairy to design diagrams, documents, and workflows instantly. Harness AI to brainstorm, plan, and build—all in one platform.
Table of Contents

Introduction
 Manage all your work in one placeCollaborate with your teamUse Cloudairy for FREE—forever


 Related Articles