What Is a Flowchart? Definition, Symbols, Types & Examples
.webp)

AI Workspace for Diagrams & Collaboration
Get your team started in minutes
Sign up with your work email for seamless collaboration.
A flowchart is a simple flow that shows how something works. it uses shapes and arrows to show each steps in the right order. This makes even a hard process easy to understand because everything is broken into small, clear steps.
A flowchart is a diagram that explains the order of actions in a process using arrows and fixed shapes. It can show manual work, computer actions, inputs, outputs, decisions, and how data moves. Because it is clear and simple, a flowchart diagram helps teams quickly see how information flows, find slow steps, and remove anything not needed.
Because a flowchart is clear and easy to read, it helps teams see how work flows, find slow or confusing steps, and remove anything that is not needed.
Flowcharts are used in many areas, like:
Flowcharts turn big, complex ideas into simple pictures anyone can follow. So if someone asks, “What is a flowchart used for?”
Flowcharts use special shapes called flowchart symbols. These shapes help show actions, choices, and the path of a workflow. Because these symbols are used everywhere, they make flowcharts easy to read and help everyone understand each step clearly.
 (2).webp)
1. Terminator (Start/End)
This shape shows where a process starts and where it ends. It helps everyone know the beginning and the finishing point of any flowchart.
2. Process Symbol
This rectangle shows an action or a task that needs to be done. Most steps in a flowchart use this shape so the work is easy to see and understand.
3. Decision Symbol
The diamond shape shows a point where you must choose between two options. It usually asks a yes/no or true/false question and sends the flowchart in different directions.
4. Input/Output Symbol
This slanted box shows information coming in or going out. It tells you when a user gives information or when the system gives a result.
5. Flow Lines (Arrows)
Arrows show the direction of the steps. They help you follow the flowchart in the correct order.
6. Connector Symbol
A small circle helps connect different parts of a big flowchart. It is used when the chart continues on another page or in another section.
7. Document Symbol
This shape shows a single document that is used or made in the process. It is often used in office, HR, or approval flowcharts.
8. Multiple Documents Symbol
This shape is used when there are two or more documents at the same time. It helps show things like multi-page reports or a group of papers.
9. Predefined Process (Subprocess)
A rectangle with double lines shows a process that is already made somewhere else. It means those steps are reused in the current flowchart.
10. Data Storage Symbol
This shape shows where data is stored, like in a database or file system. It is very important in system and data-related flowcharts.
.webp)
Flowcharts help make work easier by showing steps in a clear picture. They turn big or hard tasks into small, simple parts. When people work in a team, everyone needs to understand the whole process, not just their own job. A flowchart helps everyone see the full path from start to end.One big benefit of a flowchart is that it helps you see when something takes too long. If a step is slow or if a decision stops the flow, the chart makes it easy to find the problem.
A good flowchart design becomes a simple language that all teams can understand. This works for:
Because the steps are shown with pictures, there is less confusion than long written notes. This also helps new people learn faster and makes training easy.
When a process is shown in a flowchart, everyone follows the same steps every time. This helps reduce mistakes and keeps the workflow clean and clear. Many companies use flowcharts for quality checks, rules, and organized systems.
They make thinking clear, show how steps connect, and help teams plan good improvements. With Cloudairy, making these charts becomes fast and simple, helping teams improve processes and work better together.
Making a flowchart is easy when you plan it well. Here is a simple 5-step guide to make a clear and correct flowchart:
.webp)
Step 1: Define the purpose of the Flowchart
Before you start drawing, think about what your flowchart is going to show.Is it for a business process, a computer program, or a task that repeats?knowing the purpose helps you choose the right steps and the right shapes.
Step 2: Identify the steps in the process
Write down all the steps in the process.This includes actions, choices, information coming in, and information going out.When you list everything, your flowchart will show the whole process from start to finish.
Step 3: Arrange the steps in sequential order
Put the steps in the correct order.A flowchart should move from one step to the next in a clear path. If there are choices or different paths , make sure they are shown clearly.
Step 4: Select the right flowchart shapes and symbols
use the correct shapes for each step.Rectangels show tasks, diamond show decisions, and ovals show the start or end.Using standard shapes helps everyone understand the chart.
Step 5: Draw the Flowchart Using a Dedicated Tool
Use a tool like Cloudairy to place shapes, add arrows, and build the chart easily.After drawing, check everything again, remove extra steps, and make sure the flowchart is easy to read.These steps help you make simple or detailed flowcharts for any kind of work.
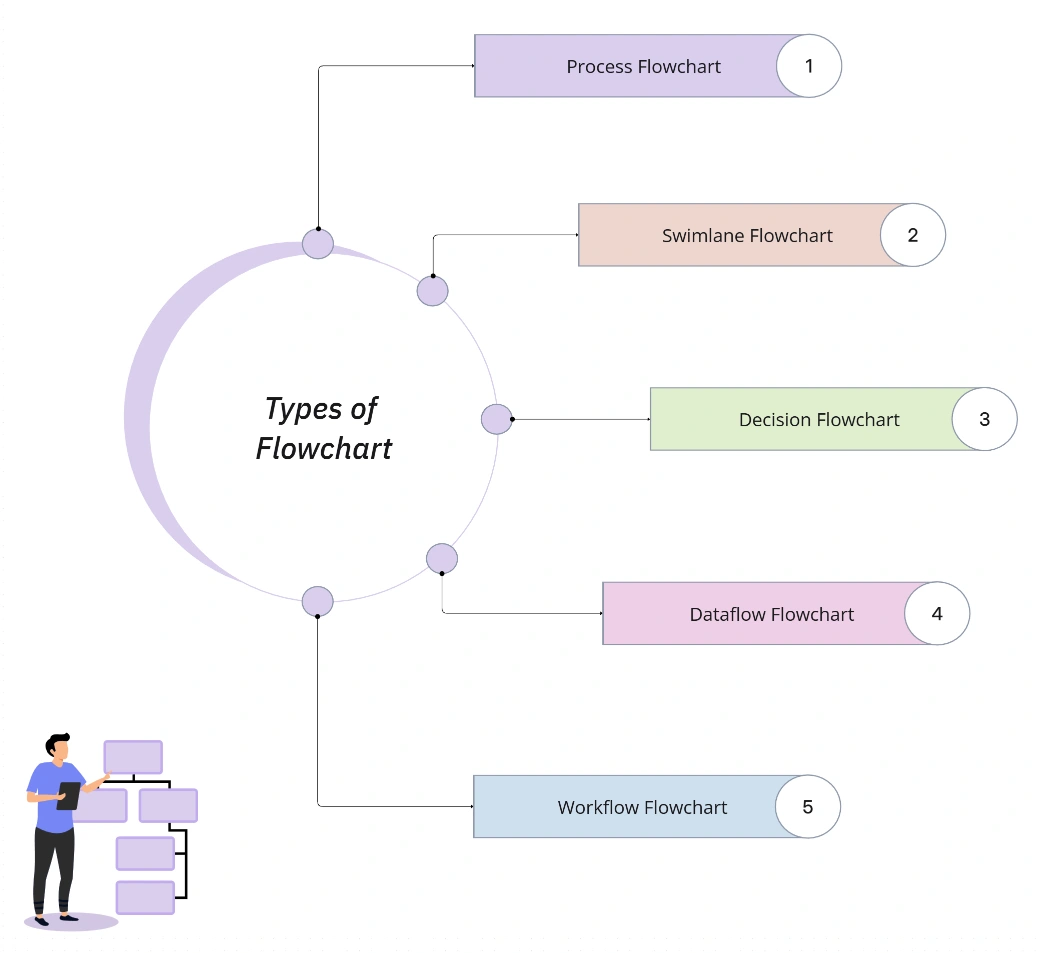
Flowcharts come in many types, and each one is good for a different job.These different flowchart styles help show systems, workflows, and decision paths.Below are the most common types used today.
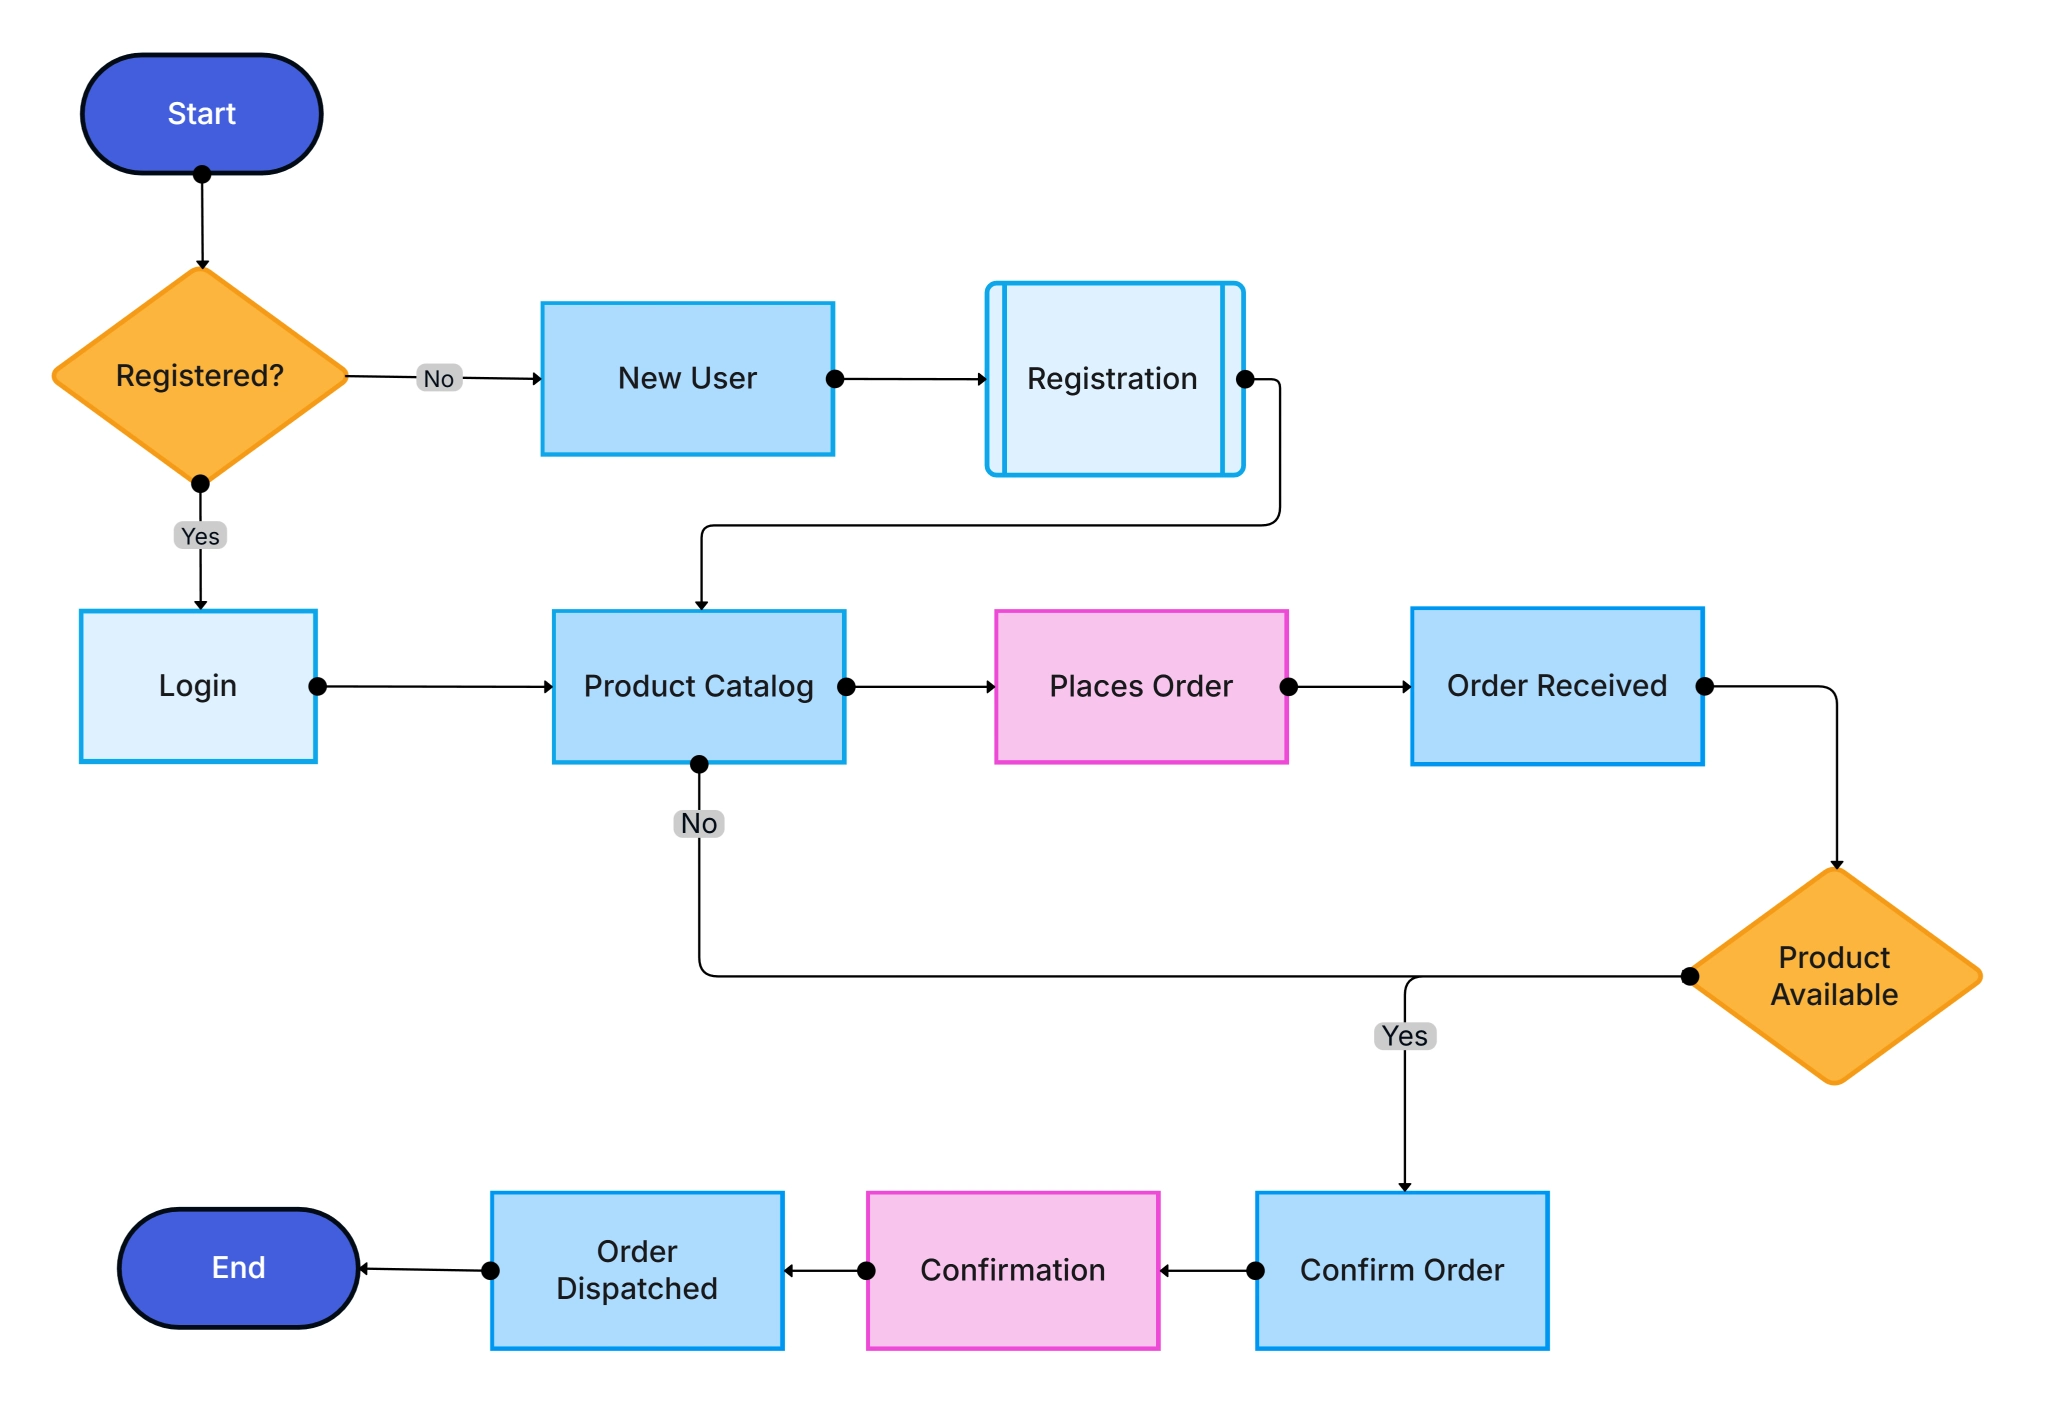
A decision flowchart focuses on the decision-making part of a process.
It uses many diamond shapes to show different choices and the paths that come after each choice.
For example, a question like “Is the payment approved?” can lead to different steps based on “Yes” or “No.”
This type of flowchart is used in things like risk checks, customer service, and automated systems where many different results can happen.
Decision flowcharts make hard processes easy to understand by showing every possible path.
They are very helpful for:
If you are making a chatbot, building software, or showing how a business decision works, a decision flowchart makes everything clear and simple.
.webp)
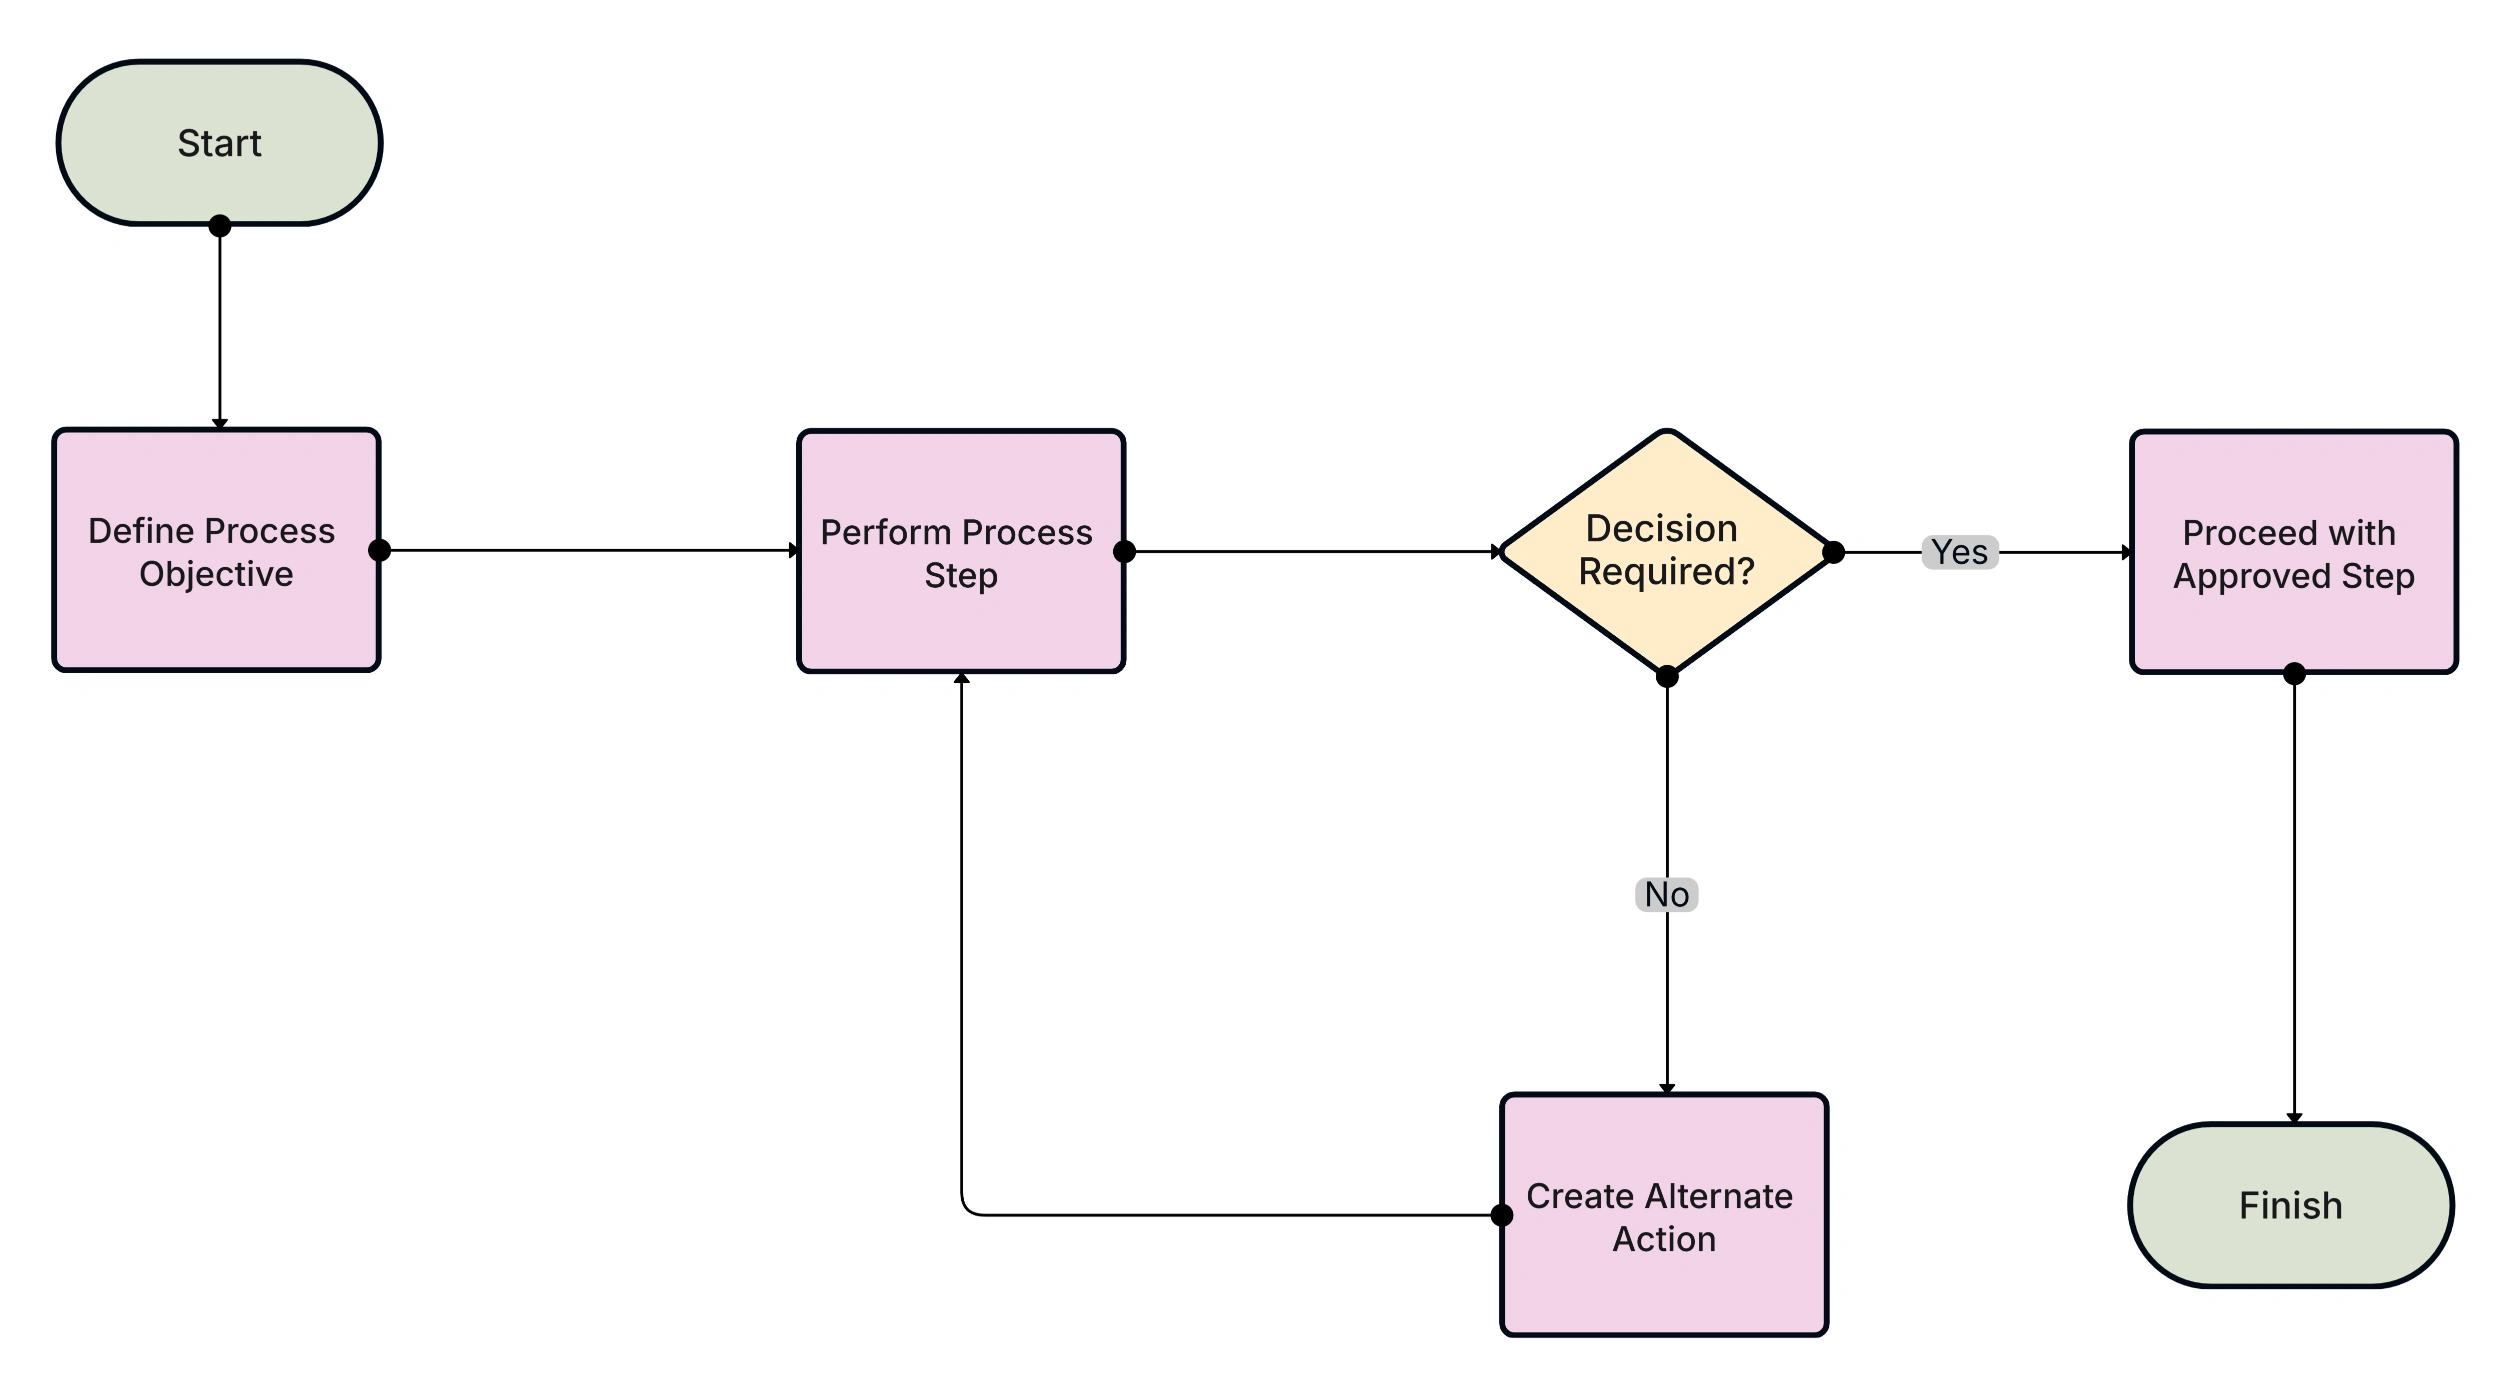
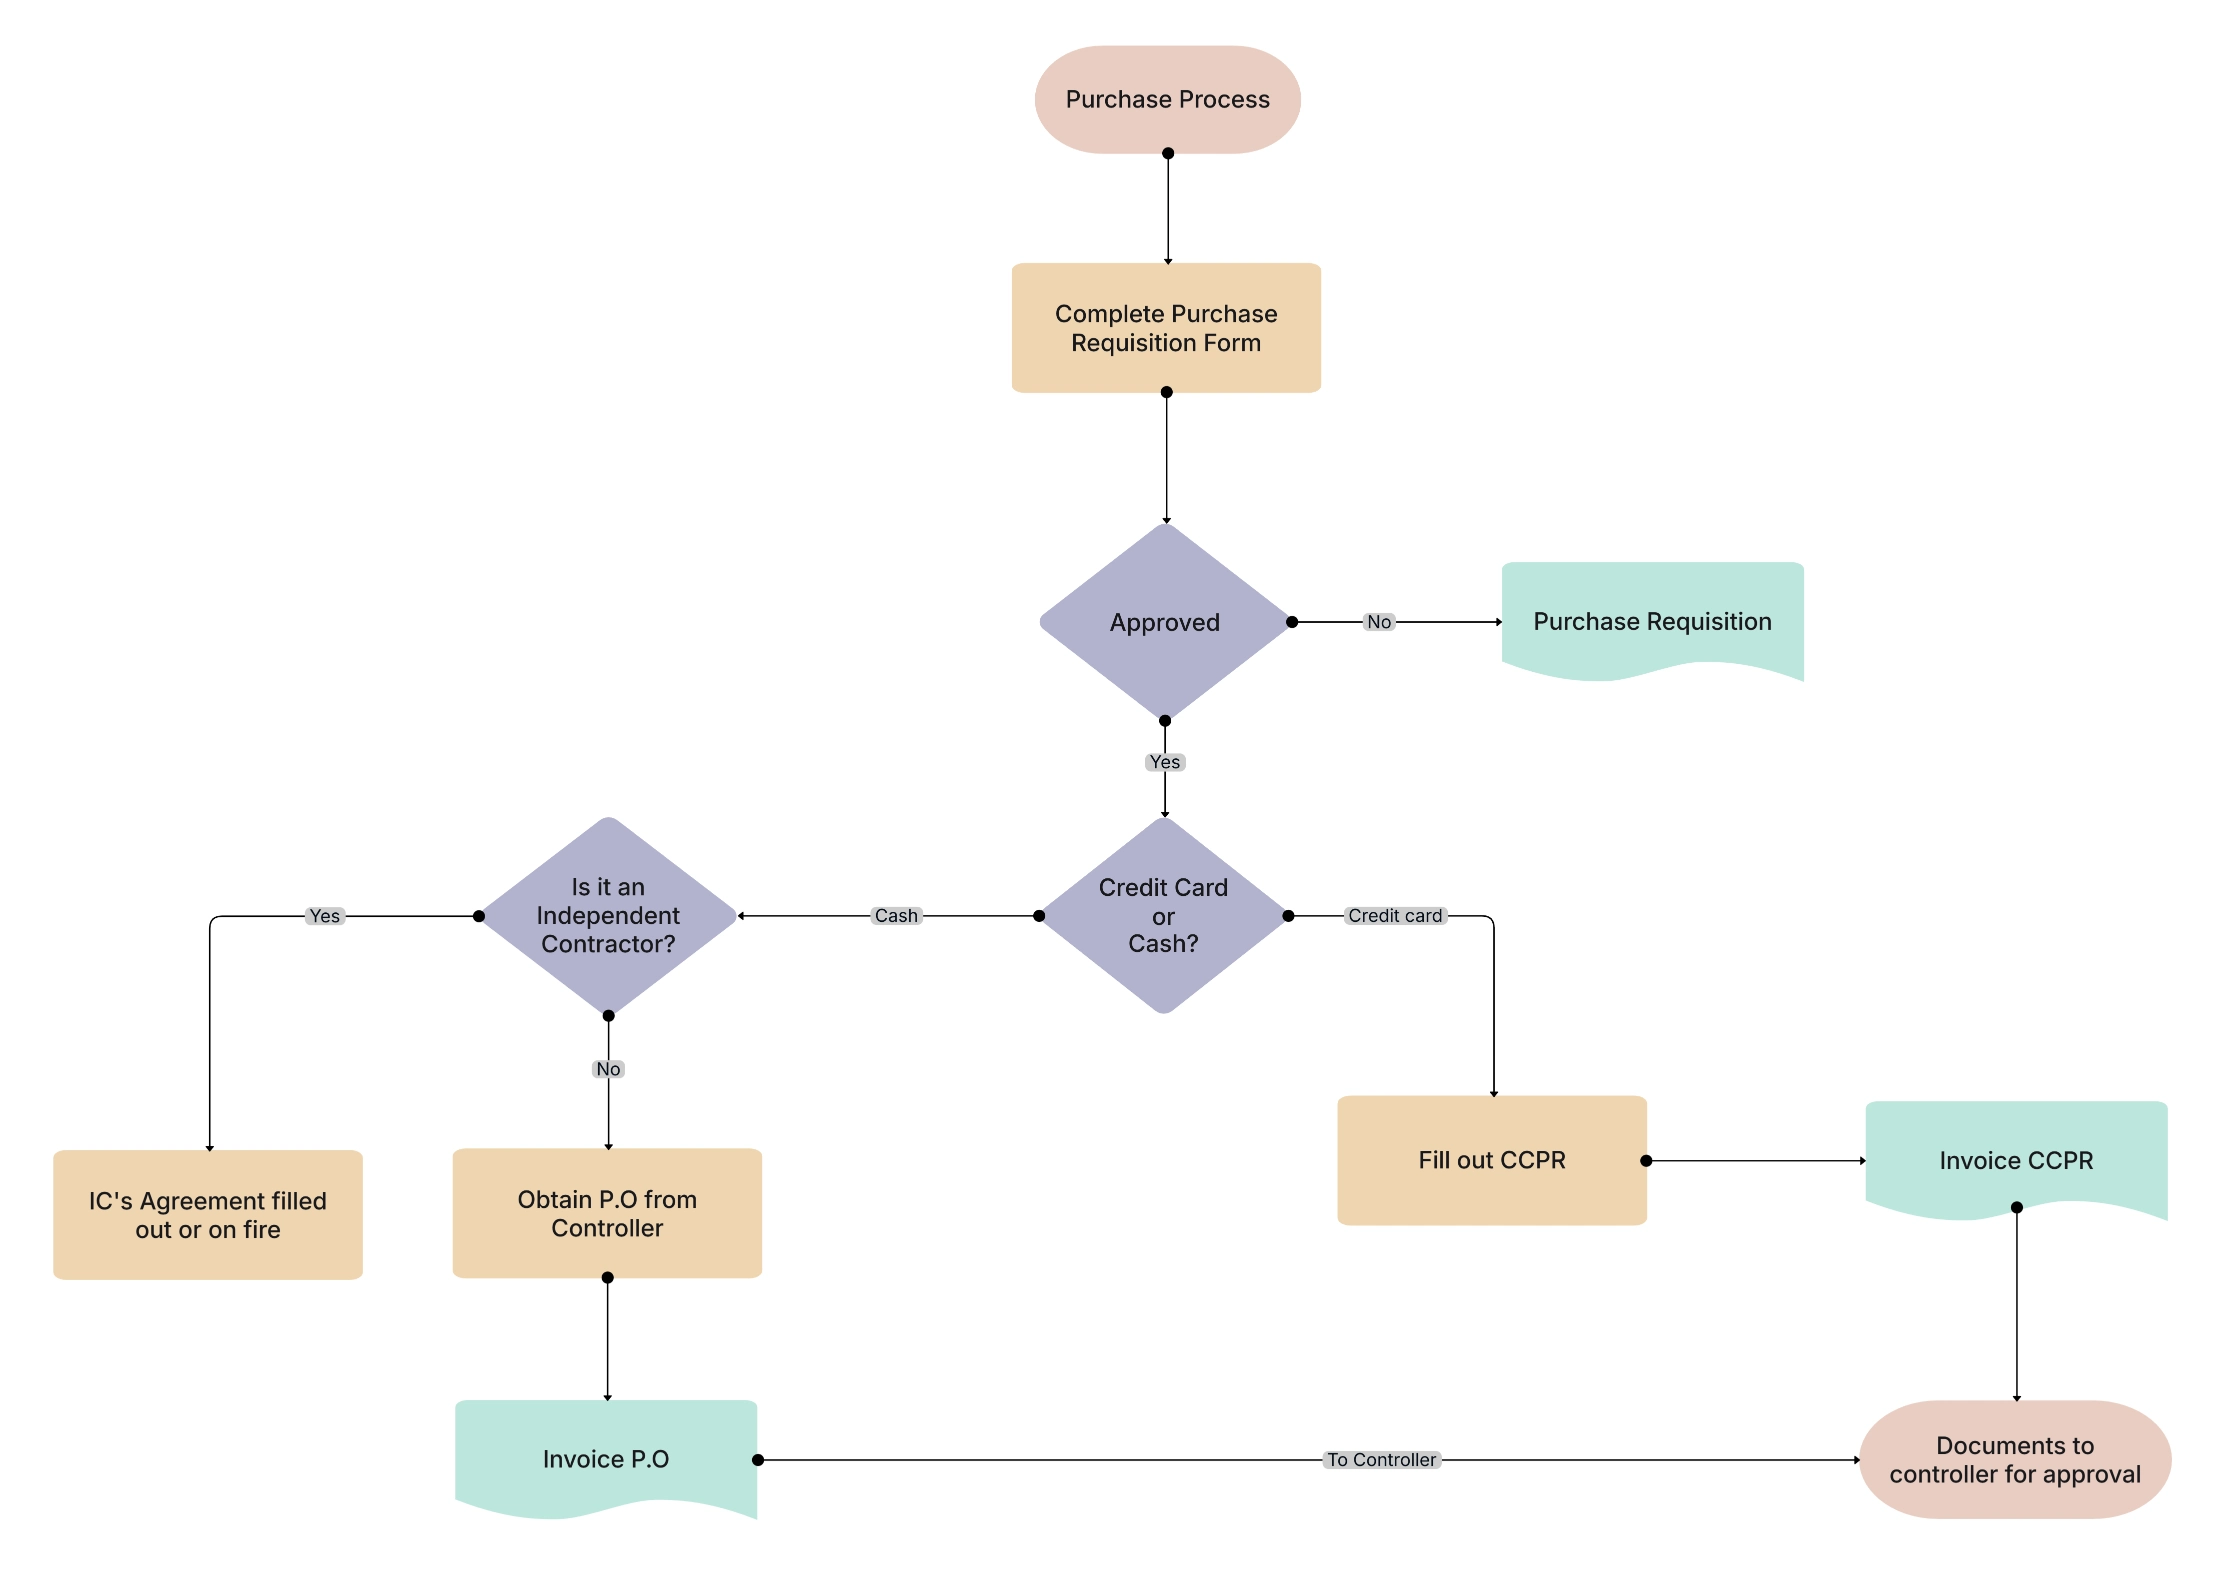
A process flowchart shows all the steps needed to finish a task or workflow.It highlights actions, changes, inputs, outputs, and choices.This is the most common flowchart used in many industries.
Process flowcharts are important for quality checks, audits, manufacturing, shipping, and service work.They help teams see every step from start to end, making it easy to find slow steps, waste, or repeated action.
.png)
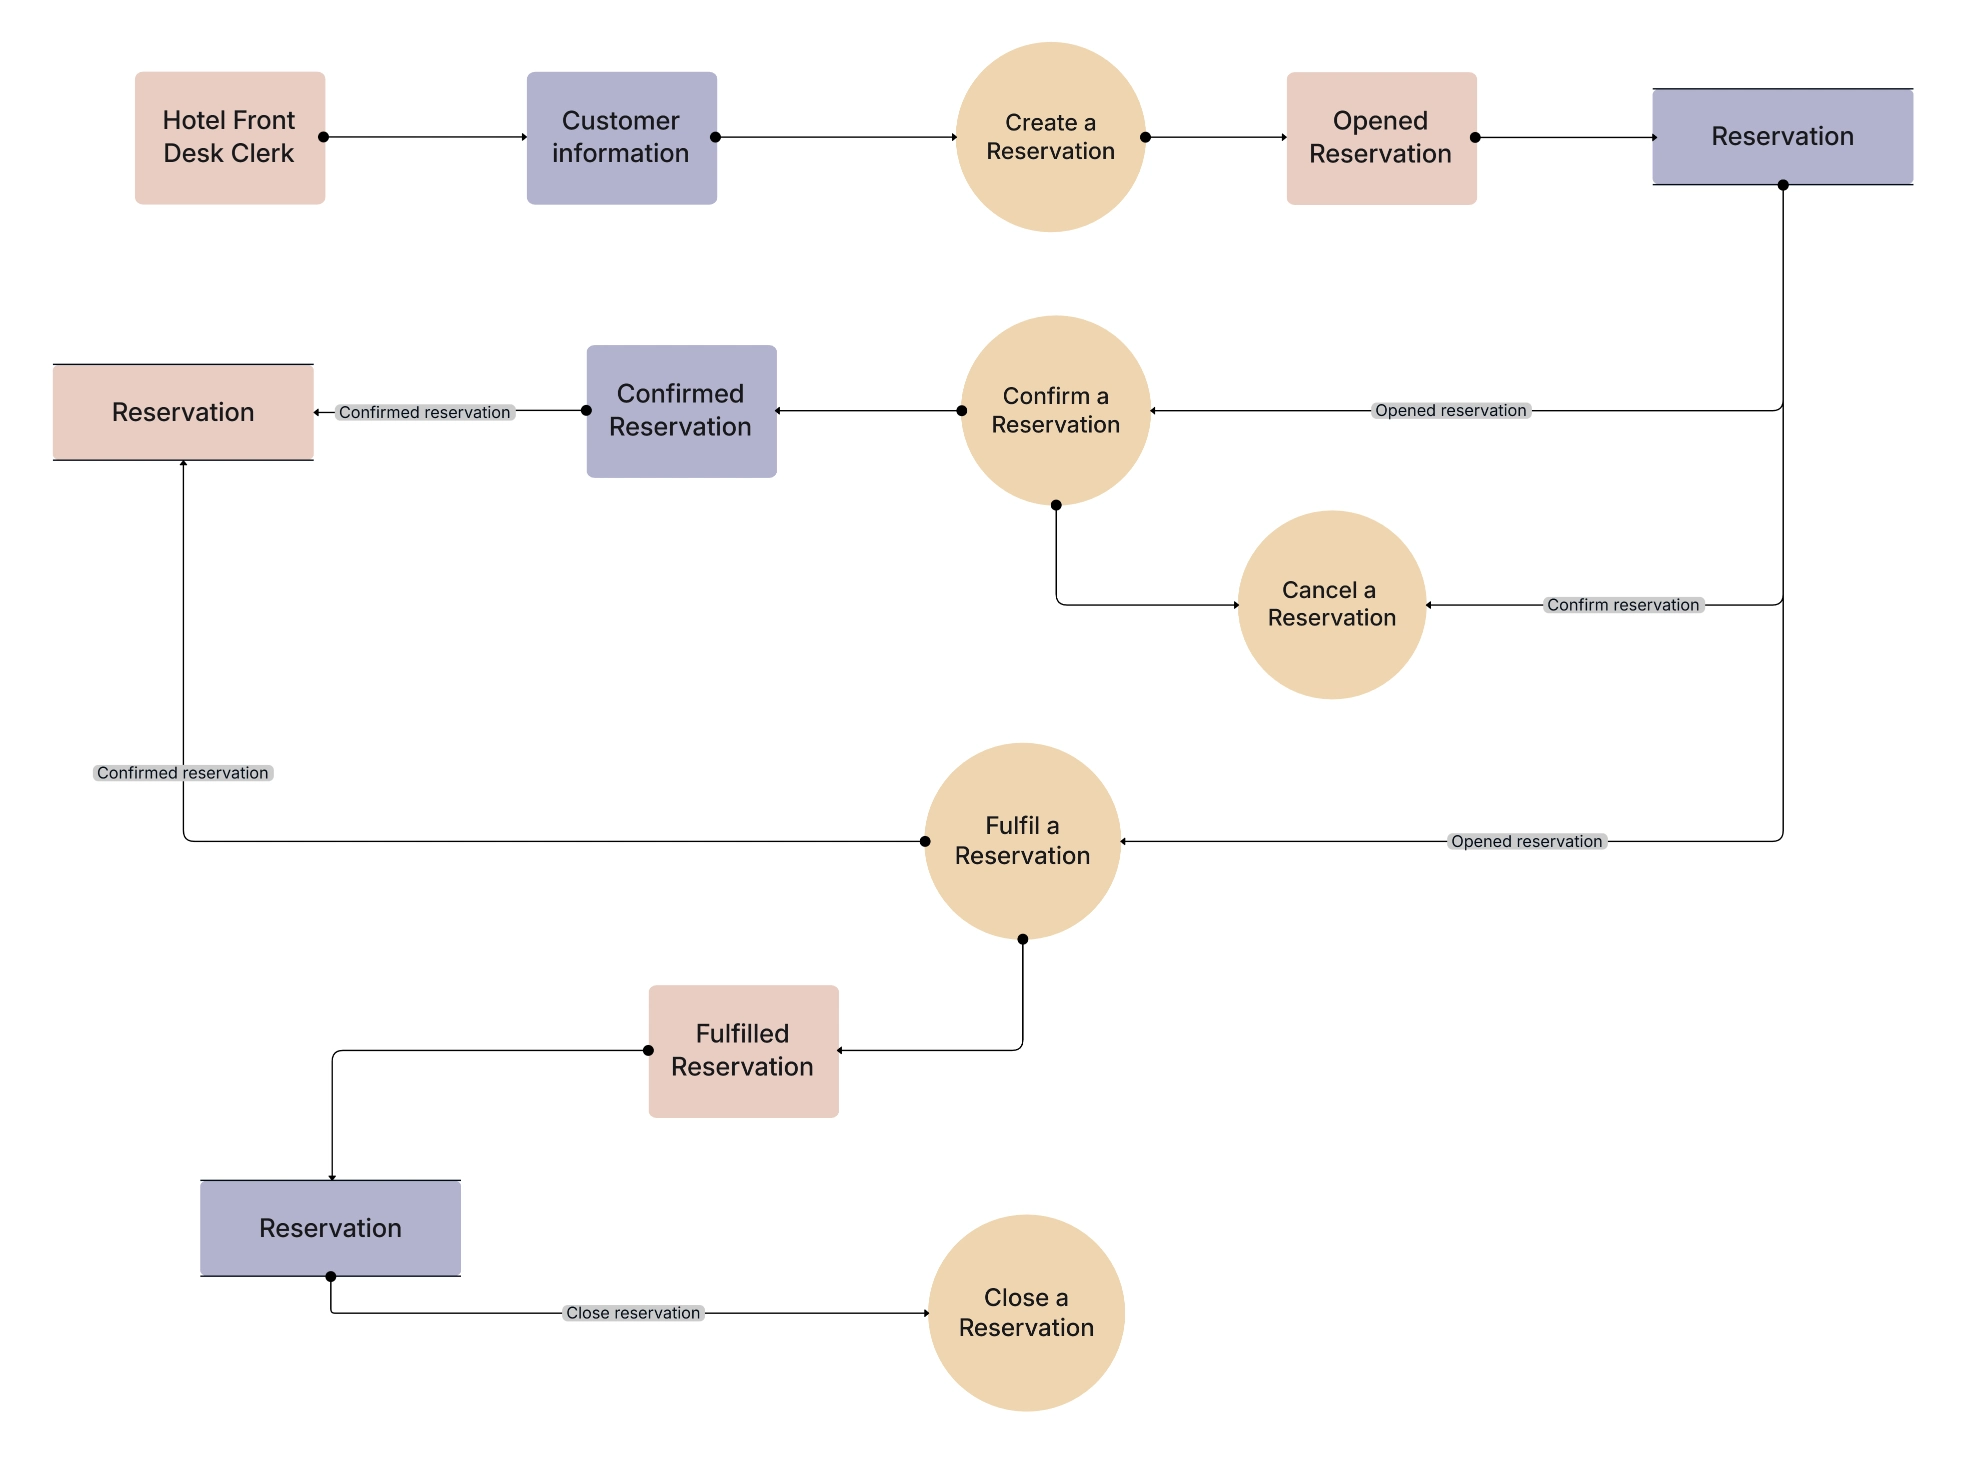
A workflow diagram shows how tasks move between people, teams, or departments. It focuses on how work passes from one person to another.
This type is great for mapping processes, HR tasks, onboarding, and office operations. Workflow diagrams are a big part of business process management because they make responsibilities clear.
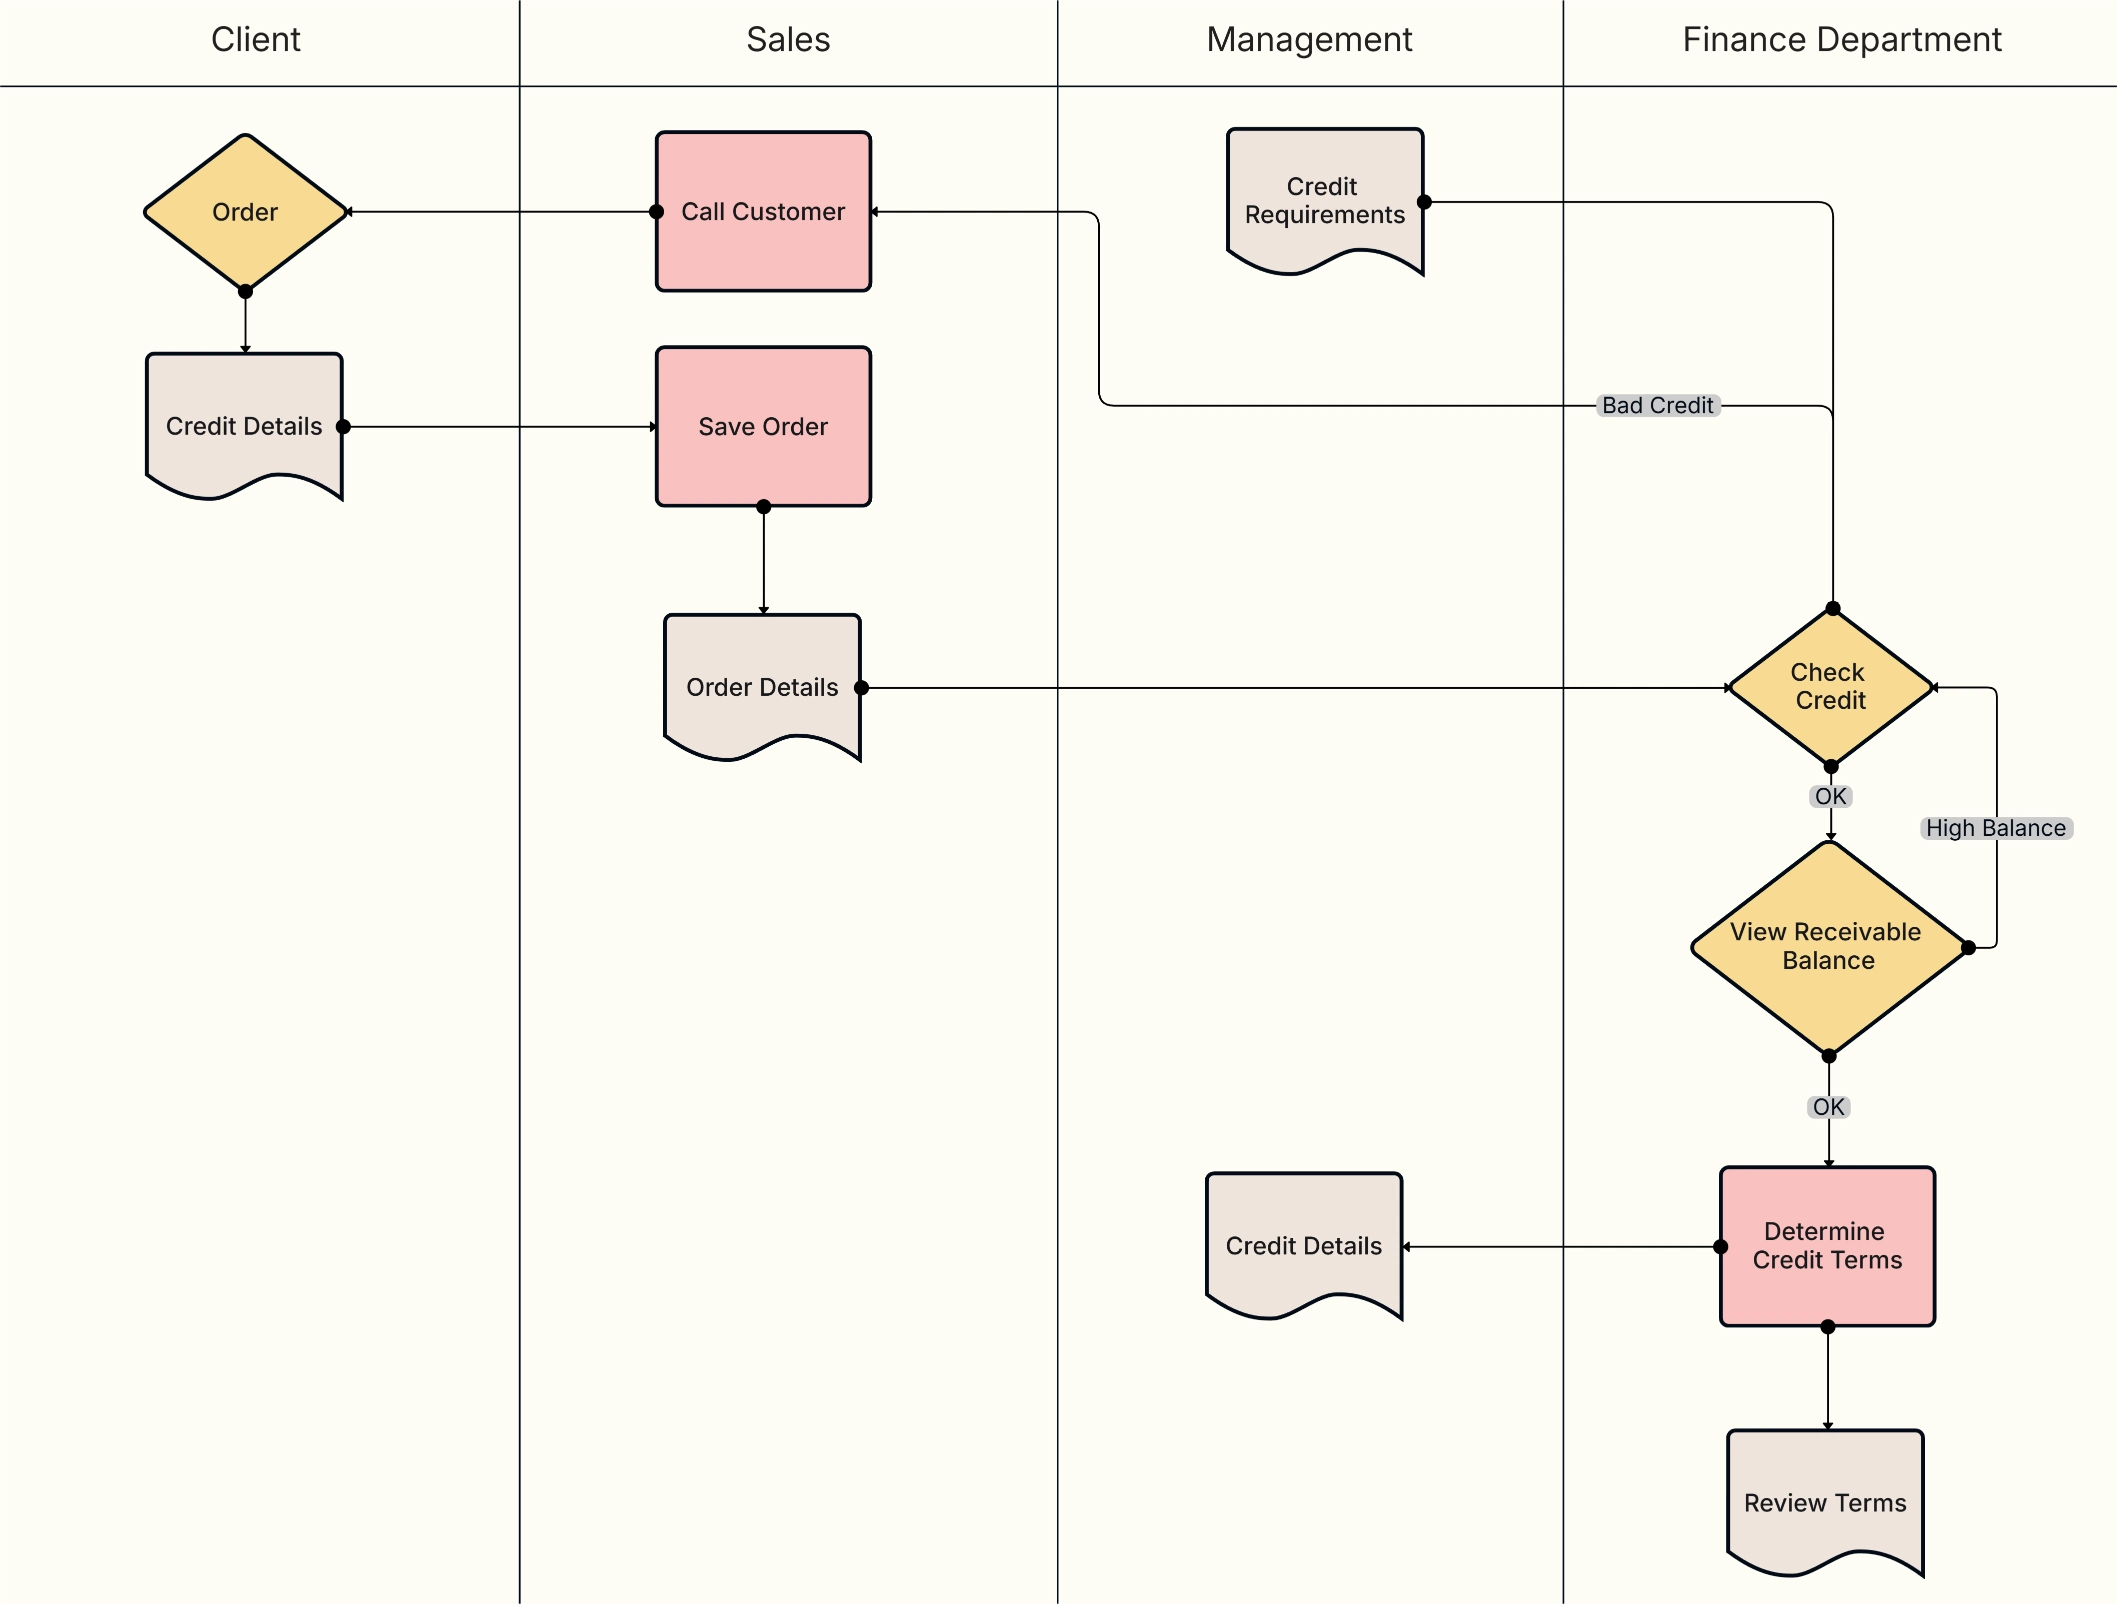
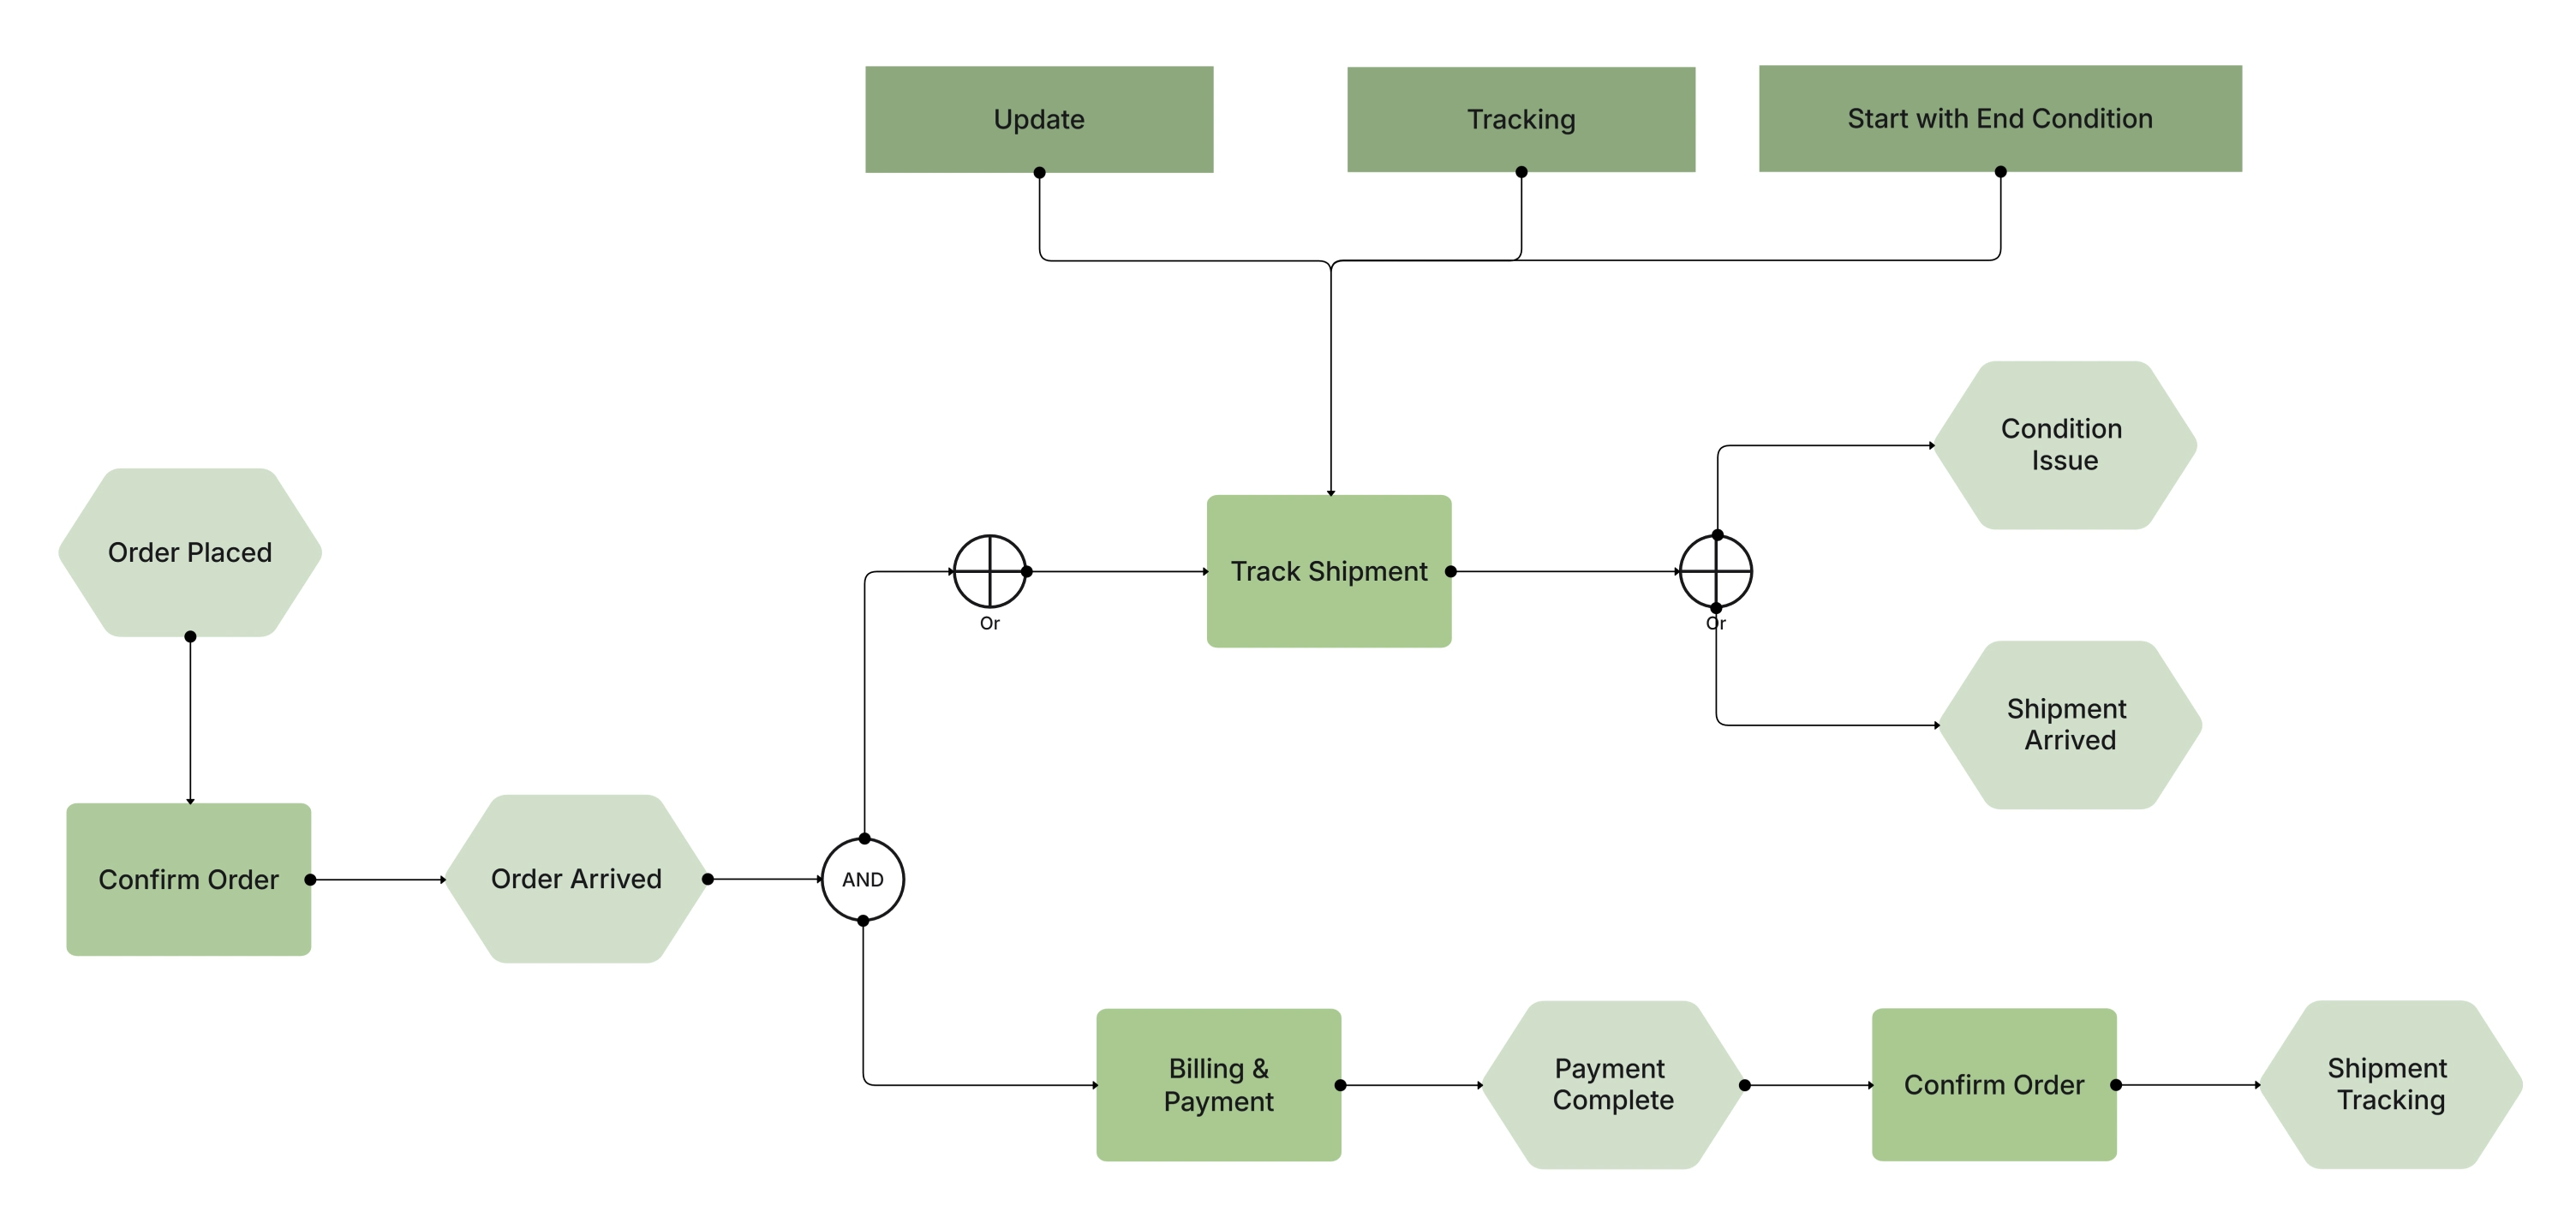
A swimlane flowchart splits the process into lanes for different teams or roles. Each lane shows the steps done by that group.
These charts are used in operations, supply chains, customer service, and company procedures.They show the order of steps and who is responsible for each one.
A DFD shows how data moves in a system.It focuses on data storage, data changes, outside users, and data flow. DFDs are very important in software design, system analysis, and databases. They make complex data systems simple and clear.
A program flowchart shows how a computer program or algorithm works.It includes loops, choices, math steps, and outputs. Program flowcharts are used in coding, system design, and fixing software issues.
A system flowchart shows how hardware, software, and digital tools work together.It includes databases, processes, and how information moves.IT teams use system flowcharts to understand modules, fix problems, and improve systems.
A PFD is used mostly in engineering.It shows machines, sensors, valves, and industrial steps.
This type is important in manufacturing and factory design.
An EPC flowchart is used for big business process modeling.It shows events, actions, and company units in detail.EPCs are common in ERP, SAP systems, and large business workflows.
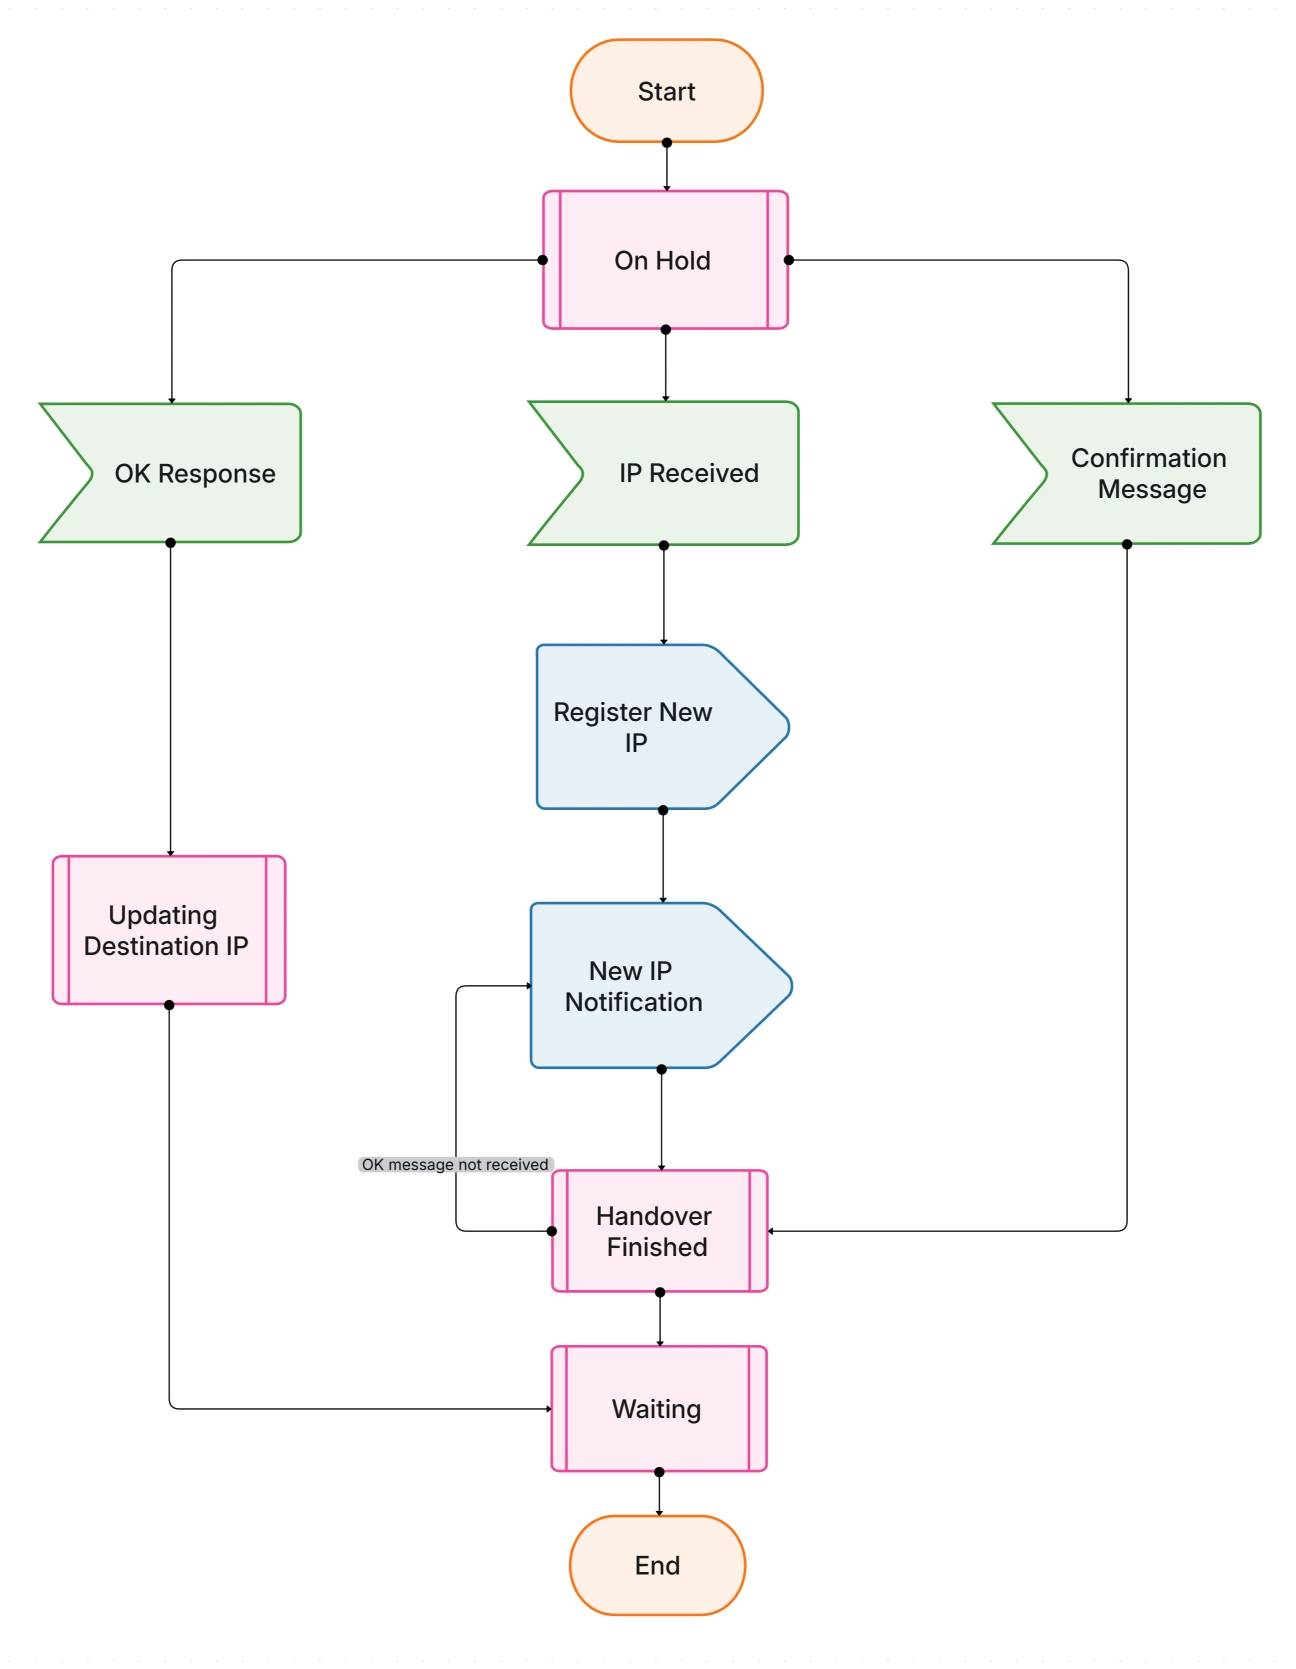
An SDL flowchart is used for communication systems and real-time control. It helps explain complex, event-based actions clearly.It is used in telecom, networks, robotics, and embedded systems.
Flowcharts can be used almost anywhere a process has steps. They are perfect for showing how work moves, how decisions are made, or how systems work.
Use a flowchart when you are:
Whenever you need clarity or structure, a flowchart helps.
Flowcharts make processes easy to understand.They turn confusing steps into clear pictures that anyone can follow.
Here are the main benefits:
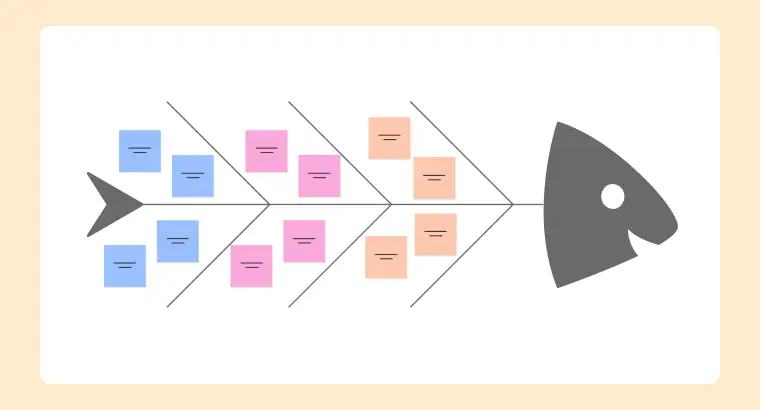
Similarly, tools like an Ishikawa diagram help identify process bottlenecks, while an org chart and concept map improve communication and strategic planning.
Choosing the right tool makes flowchart creation simple.Cloudairy gives you a smart, fast, and AI-powered way to build diagrams without stress.
Cloudairy gives everything you need to create clean, professional flowcharts.
If someone asks, “What is the best tool to design a flowchart?”
The answer is Cloudairy.
Flowchart templates help you start quickly with ready-made layouts. Instead of making diagrams from scratch, Cloudairy gives templates for business, software, operations, and decision workflows. Here are some examples:
1. Simple Process Flowchart: Shows basic step-by-step tasks like onboarding or simple work sequences. Uses arrows and actions to guide the flow.
2. Decision Tree Flowchart: Shows how steps change based on “Yes” or “No” choices. Great for troubleshooting, customer support, and automated decisions.
3. Employee Onboarding Workflow: Shows every stage from hiring a new employee to full integration. Perfect for HR teams.
4. Customer Support Resolution Flowchart: Guides support agents through identifying problems, troubleshooting, escalating, and closing issues.
5. Project Approval Flowchart: Shows submission, review, revision, and final approval. Useful for project management.
6. Sales Pipeline Flowchart: Shows how leads are qualified, nurtured, negotiated, and converted into sales. Helps sales teams stay organized.
7. Order Fulfillment Flowchart: Covers order placement, processing, packing, shipping, and delivery confirmation.
8. Marketing Campaign Workflow: Maps planning, content creation, scheduling, execution, and result tracking.
9. Software Bug Fix Flowchart: Tracks bug reporting, checking, fixing, testing, and closing.
10. Data Processing Flow Diagram: shows how data moves from input to storage to output.
11. Manufacturing Process Flow Diagram: Shows machines, quality, checks, assembly, and packaging steps in production.
12. IT Ticket Management Flowchart: Maps ticket intake, triage, assignment, resolution, and feedback collection.
13. Financial Approval Flow Diagram: Shows budget request, multiple approvals, verification, and fund release.
14. Website Development Process Flowchart: Covers research, design, writing content, development, testing, deployment, and handover.
15. User Journey Flow Diagram: Shows customer steps from awareness to decision, helping teams improve experience and conversion.
With Cloudairy, you can make a clean and clear flowchart in just a few minutes. You can drag and drop shapes, change your ideas easily, and build a full workflow quickly. Because flowcharts are simple and flexible, they are still one of the most popular tools for showing how things work.
What is a flowchart?
Why are flowcharts important?
What symbols are used in flowcharts?
Where are flowcharts used?
What tool is best for creating flowcharts?
Start using Cloudairy to design diagrams, documents, and workflows instantly. Harness AI to brainstorm, plan, and build—all in one platform.
Table of Contents

Introduction
 Manage all your work in one placeCollaborate with your teamUse Cloudairy for FREE—forever