Get your team started in minutes

Sign up with your work email for seamless collaboration.

What Is an Ishikawa Diagram

What Is an Ishikawa Diagram?

Author
Cloudairy
By Cloudairy Team
February 13, 2026
5 min read

An Ishikawa diagram, also known as a fishbone diagram or cause-and-effect diagram, is a fun visual tool. It helps spot, sort, and check all the possible causes of a problem or result. Teams use it to break big, tricky issues into easy groups. This makes root cause analysis clear and neat.

This diagram comes from Kaoru Ishikawa. He was a smart Japanese expert in quality control. He made it for better quality work. Its shape looks like a fishbone. The main problem sits at the head. Many causes stick out like bones. You see fast how causes make one big effect.

An Ishikawa diagram works great in:

  • Quality control and process improvement
  • Manufacturing and operations
  • Software development and IT troubleshooting
  • Healthcare and service industries
  • Business analysis and project management

If someone asks, “What is an Ishikawa diagram used for?”, here is the easy answer:
It finds the real root cause of a problem. Not just fixes the outside signs.

Now with tools like Cloudairy, you can make an Ishikawa diagram super quick. No need for hand drawing or hard software. Just use ready templates, drag-and-drop fun, or AI to build clean, neat, and easy-to-change fishbone diagrams.

Ishikawa Diagram Symbols & Structure

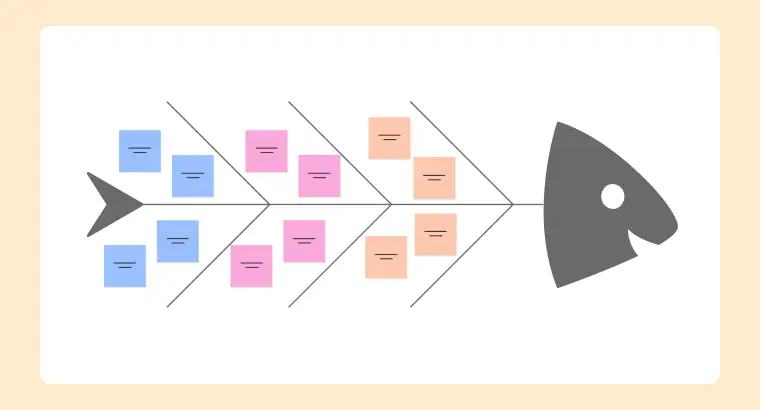
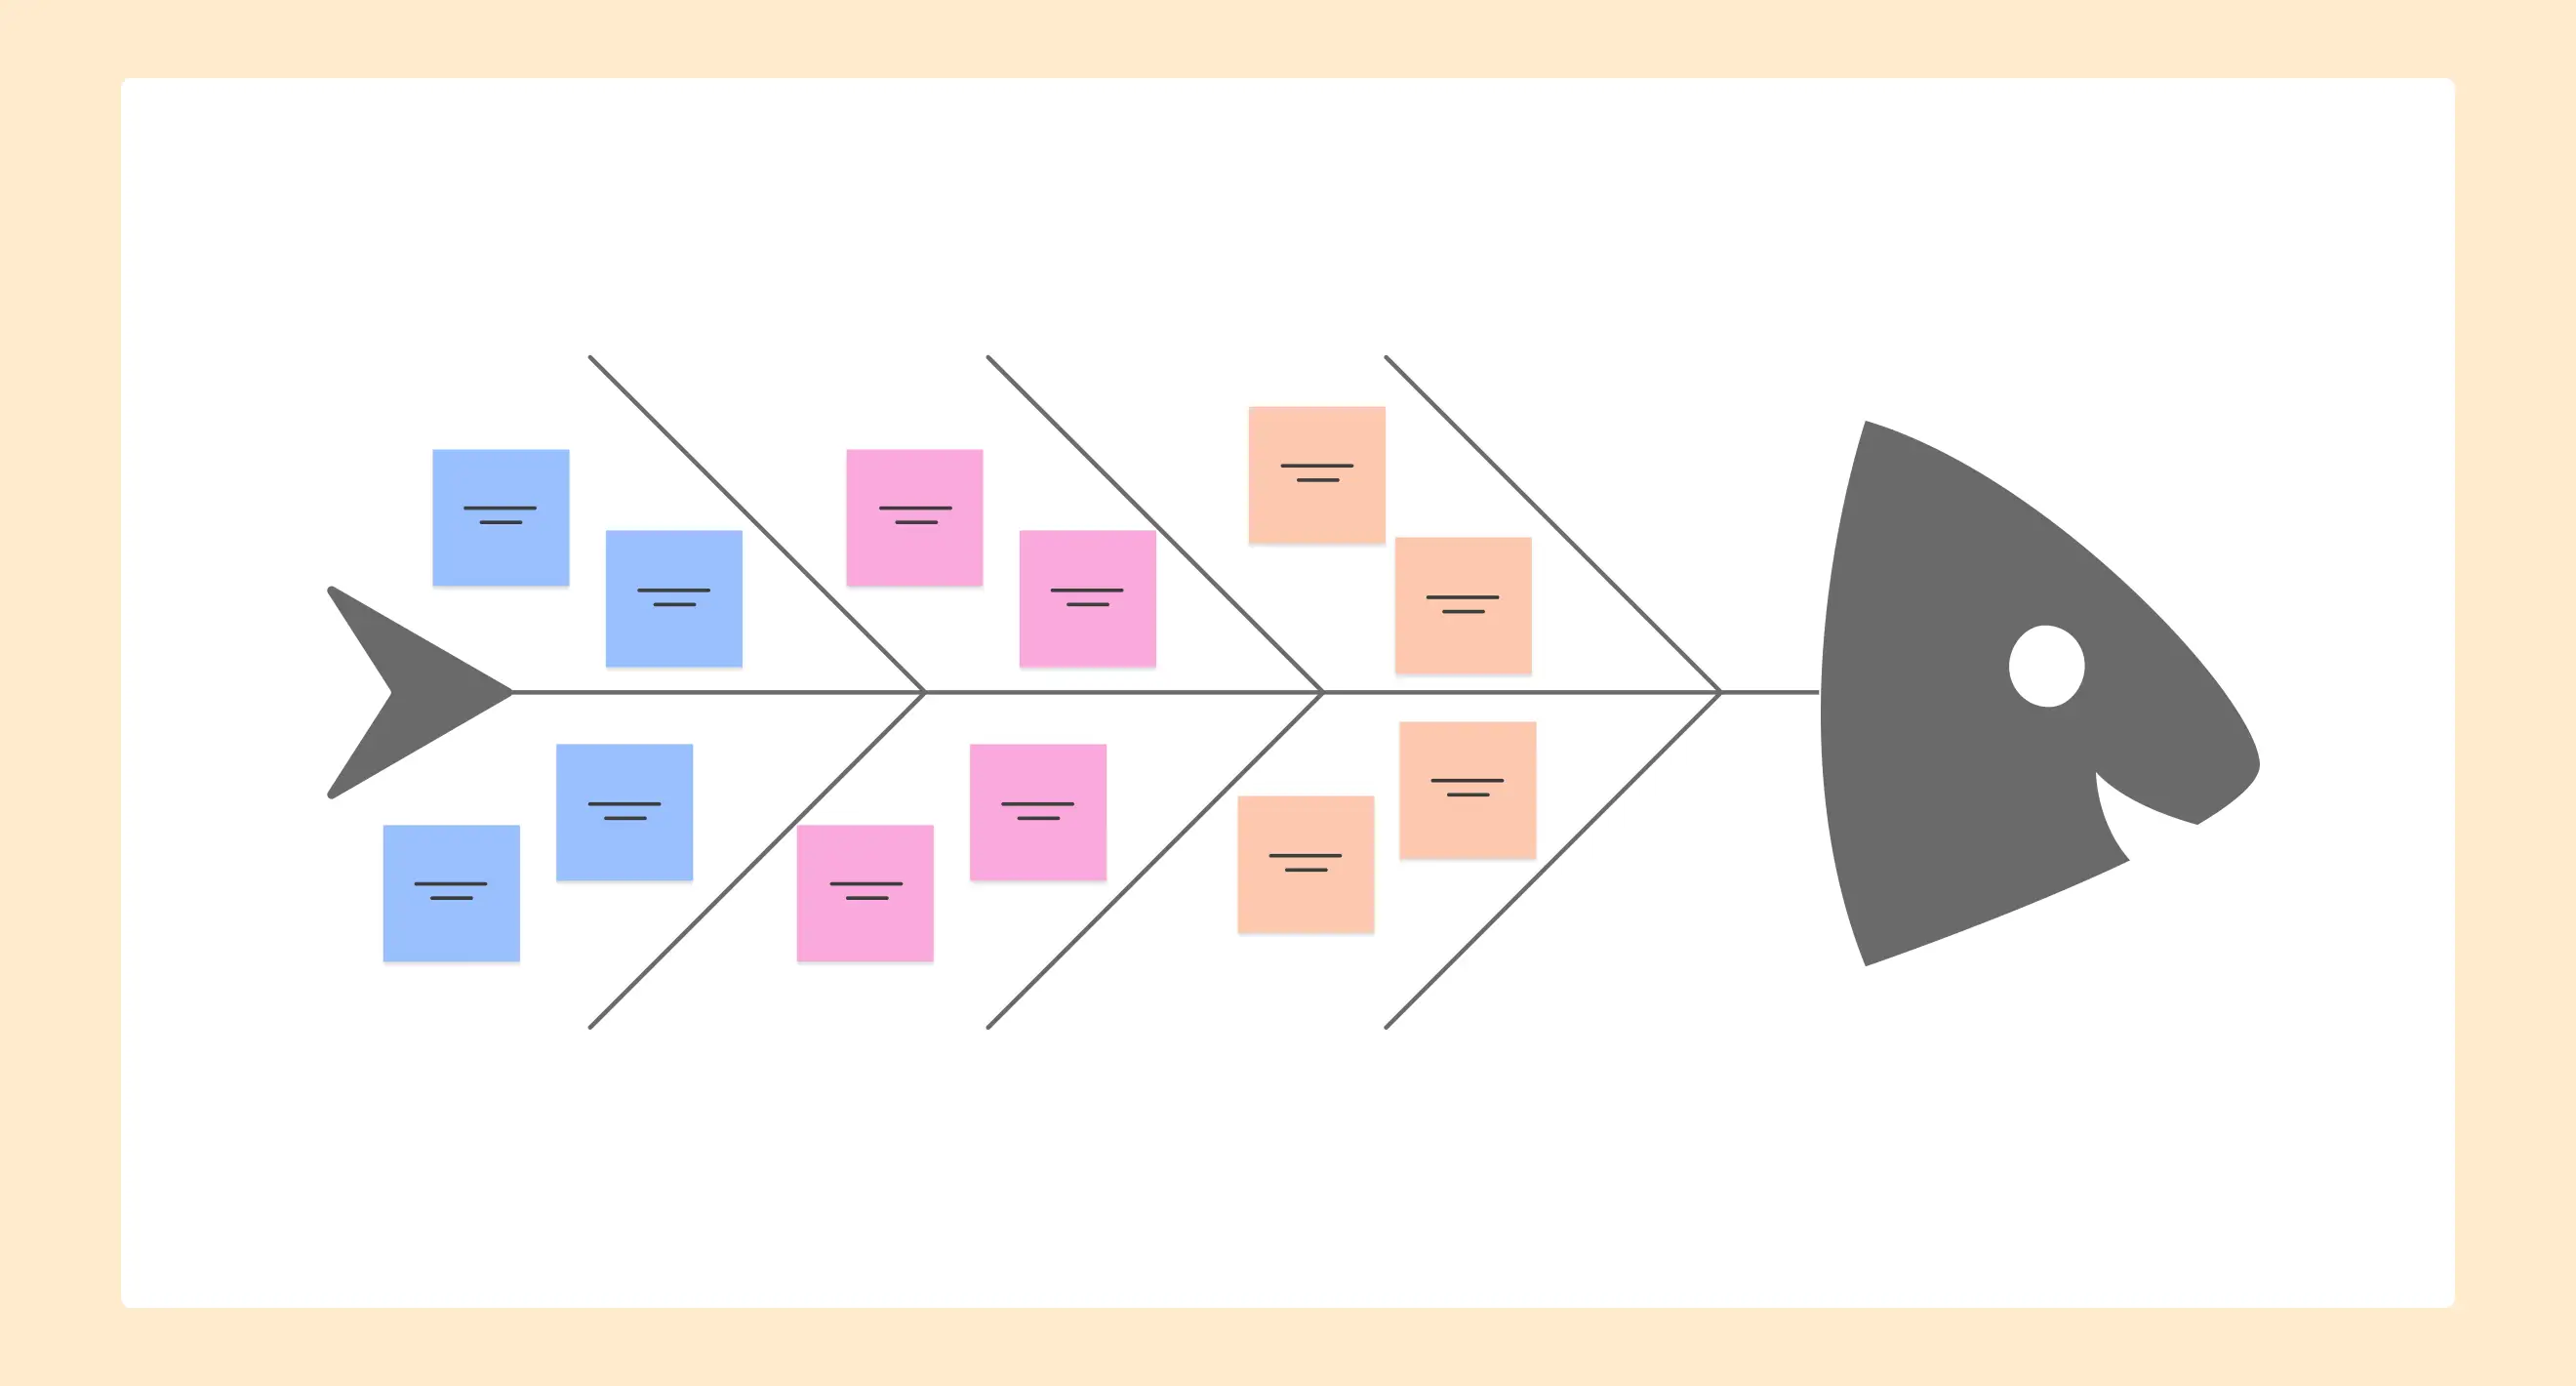
The Ishikawa diagram keeps a simple and strong setup. It skips fancy symbols for clear cause-and-effect work. Each piece fits just right to spot why things go wrong.

  1. Problem Statement (Effect / Head)
    Put the big problem at the right end. This is what you want to fix or figure out. It acts like the fish head everyone sees first.
  2. Spine (Main Line)
    Draw one straight line from left to right. It links all causes to that problem. Think of it as the fish backbone holding everything.
  3. Major Cause Categories (Main Bones)
    Big branches split off the spine. They sort causes into groups like people, process, or tech. Common ones are the 6 Ms: Man, Machine, Method, Material, Mother Nature, and Measurement.
  4. Sub-Causes (Smaller Bones)
    From each big branch, add tinier lines. These list the real details behind the problem. Teams dig deep to find the true root.
  5. Arrows and Labels
    Arrows point the way causes flow. Short words name each part. This keeps it easy to read and share with anyone, even non-tech folks.

How Does an Ishikawa Diagram Improve Problem Solving?

An Ishikawa diagram makes problem-solving better by moving from quick guesses to a clear, step-by-step check. Teams stop and look at all real causes, not just what seems wrong at first. This smart shift helps fix things right the first time.

Key Ways It Improves Workflows

Encourages Root Cause Thinking
It stops teams from quick fixes on signs of trouble. Instead, it digs to find deep issues that cause the mess.

  • Improves Team Collaboration
    Everyone adds ideas in fun brainstorms. This brings fresh views and builds strong team work.
  • Reduces Recurring Problems
    By hitting the true root causes, the same bad stuff stays away for good. No more fix, break, fix again loops.
  • Enhances Decision-Making
    The picture map of causes makes smart choices easy with real facts. Leaders see what matters most.
  • Supports Continuous Improvement
    Perfect fit for Lean, Six Sigma, and quality work. It keeps getting better over time.

With Cloudairy, teams work together live. Add notes, tweak causes, and update the Ishikawa diagram fast as new ideas pop up.

How to Plan and Create an Ishikawa Diagram

Making a good Ishikawa diagram needs clear thinking, team help, and a solid plan. These steps guide you to build one right and get real results.

Step 1: Define the Problem Clearly
Write down one exact problem you can measure. Skip fuzzy words that confuse folks.
Example:
“Low quality”
“High defect rate in product packaging”

Step 2: Identify Major Cause Categories
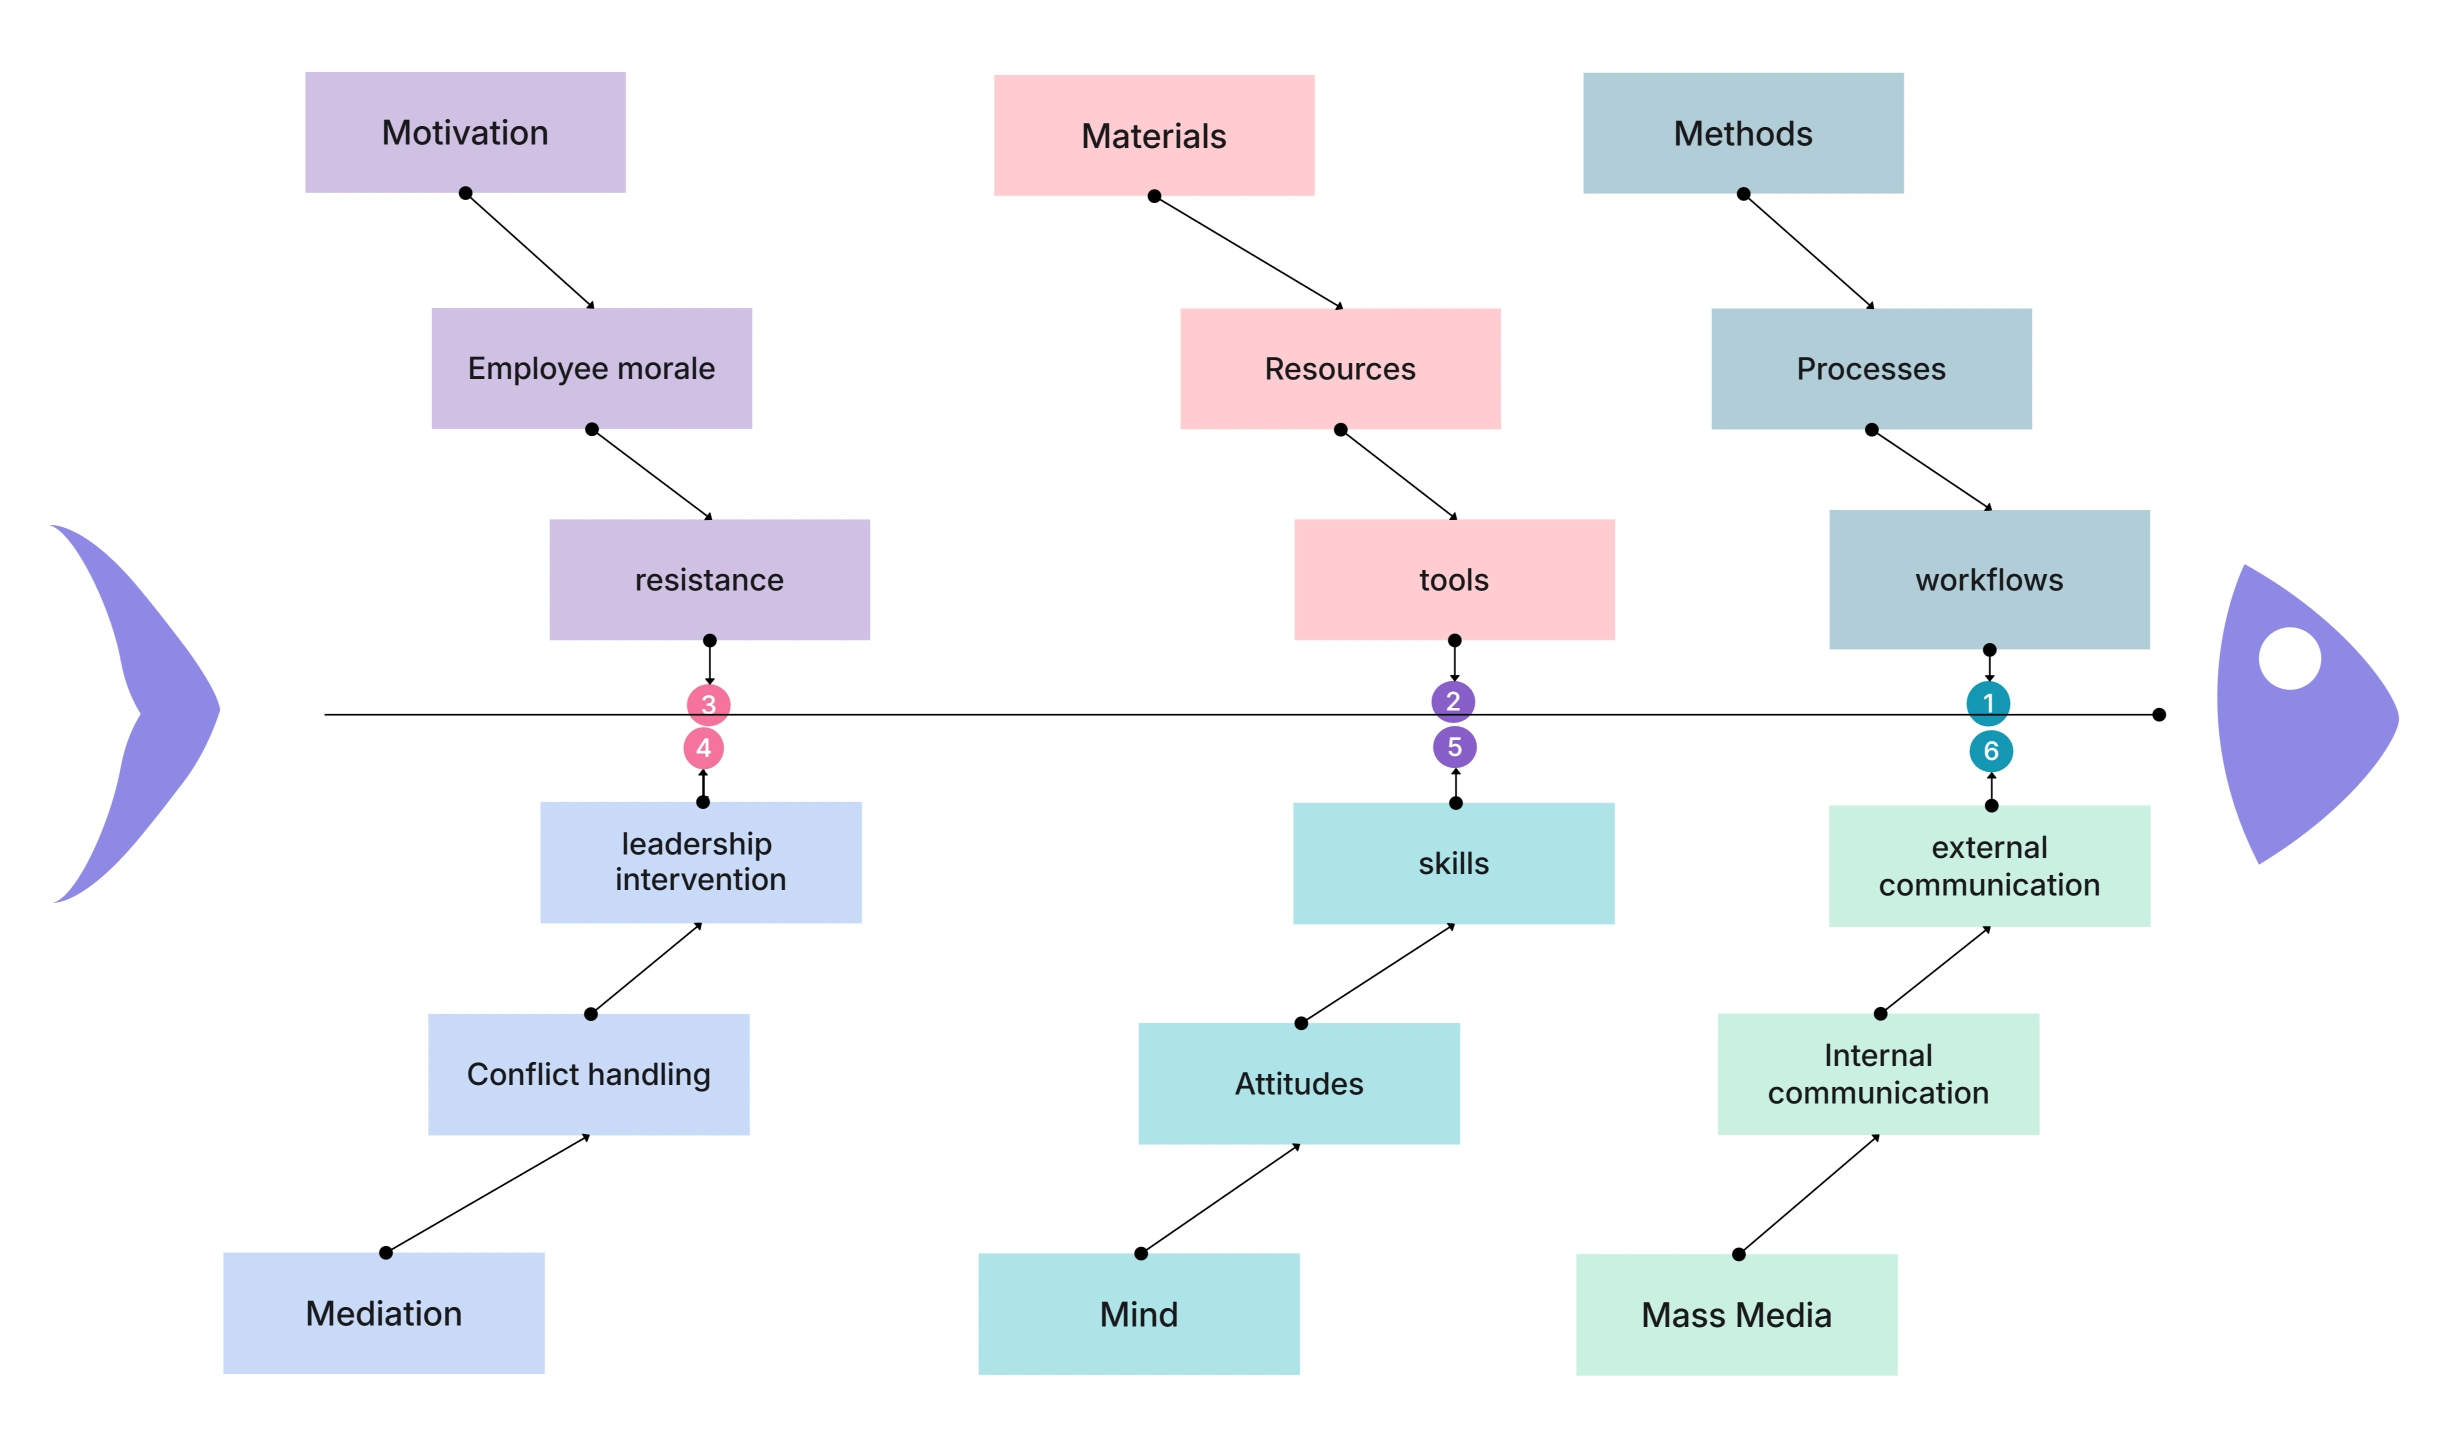
Pick groups that fit your work or field. Think people, process, machines, or materials to cover all bases.

Step 3: Brainstorm Possible Causes
Ask “Why?” over and over for each group. Jot down every idea fast in team chats.

Step 4: Add Sub-Causes
Split each cause into smaller bits till you hit fixes you can do. This digs to the true roots.

Step 5: Analyze and Prioritize Causes
Check which ones hit hardest. Pick top ones to tackle first with team votes or data.

Step 6: Create the Diagram Using a Tool
With Cloudairy, jump in easy:

  • Grab ready-made Ishikawa templates
  • Drag and drop cause branches
  • Work live with your team
  • Export the diagram in seconds

Types of Ishikawa Diagrams

Different problems need different cause groups in an Ishikawa diagram. Here are the top types teams use most. Each fits special work areas just right.

1. 6M Ishikawa Diagram

The 6M setup shines in factories and quality checks.
Categories:

    • Man (People)
    • Machine
    • Method
    • Material
    • Measurement
    • Mother Nature (Environment)
      Use case:
      Great for fixing production bugs, quality slips, and work fails.

6M Fishbone Diagram

2. Service Industry Ishikawa Diagram

Built for spots without factories.
Common categories:

  • People
  • Process
  • Policies
  • Technology
  • Environment
  • Customers
    Use case:
    Handles gripes from customers, slow service, and help desk woes.

Service Industry Ishikawa Diagram

3. Healthcare Ishikawa Diagram

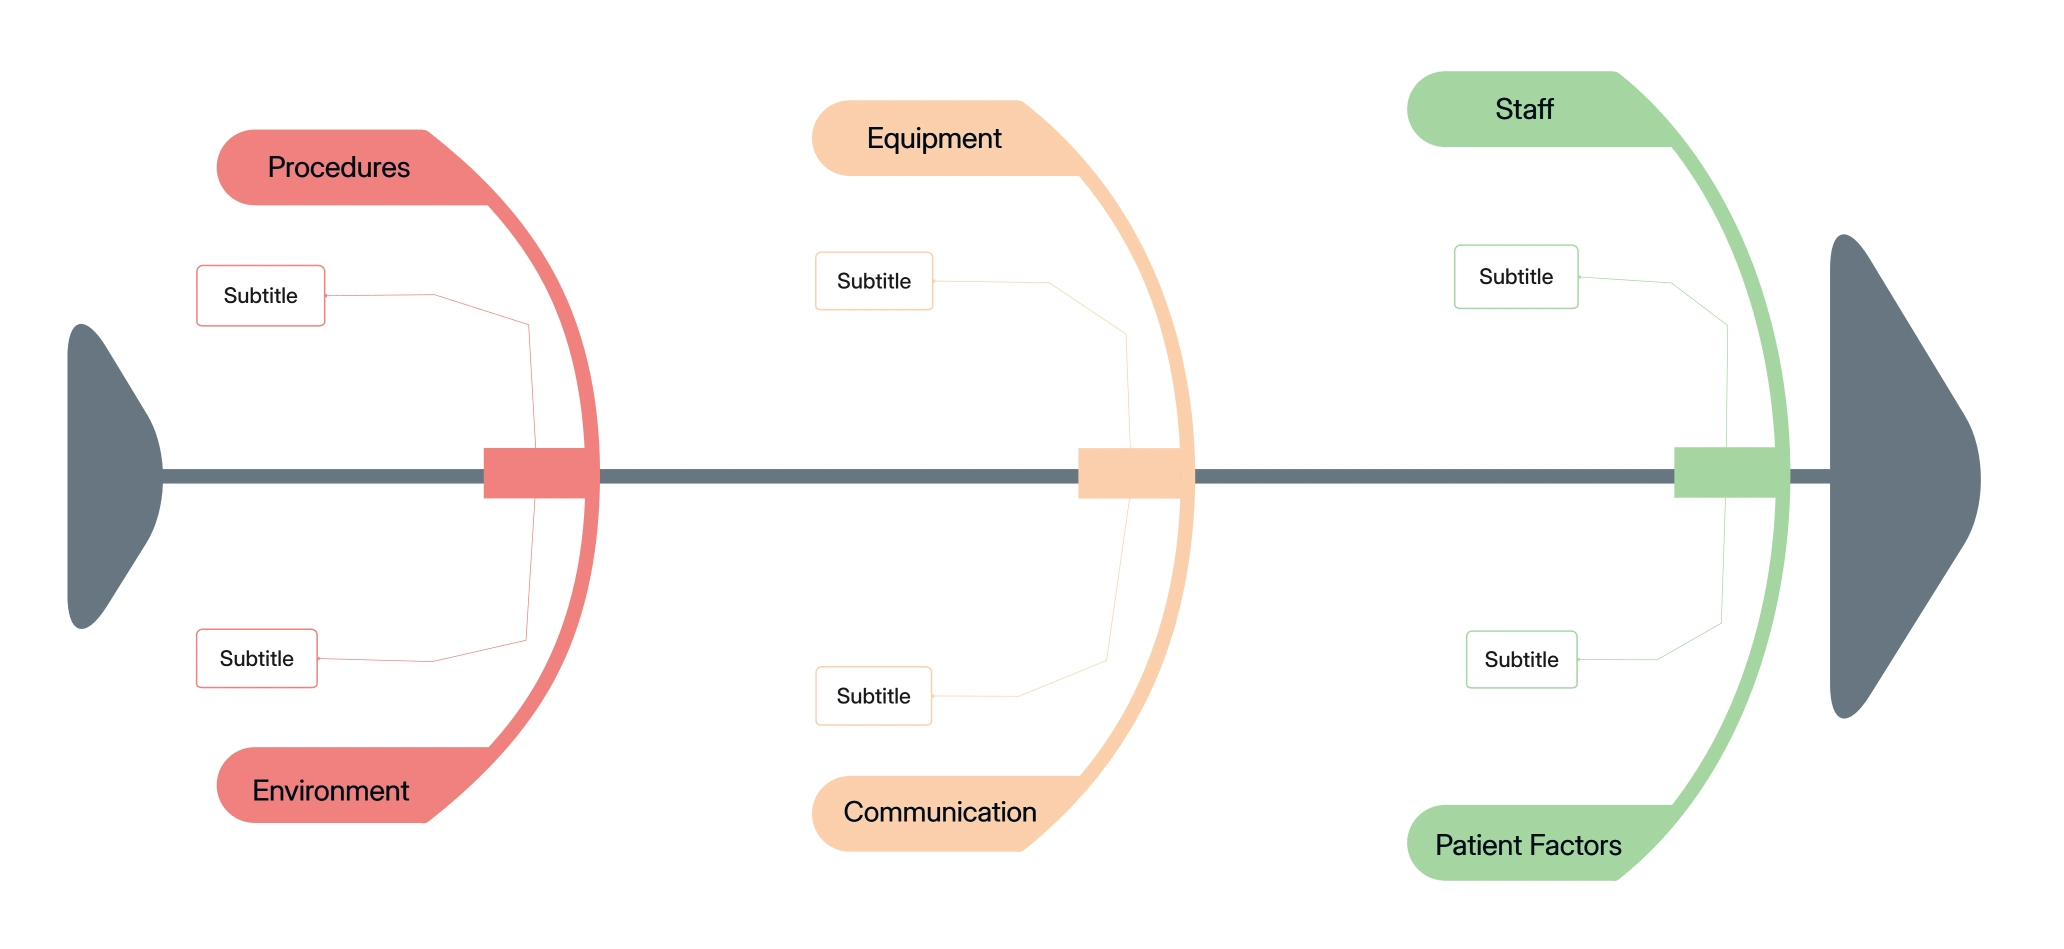
Digs into patient safety slips and doc mistakes.
Categories may include:

  • Staff
  • Equipment
  • Procedures
  • Environment
  • Communication
  • Patient Factors

Healthcare Ishikawa Diagram

4. Software & IT Ishikawa Diagram

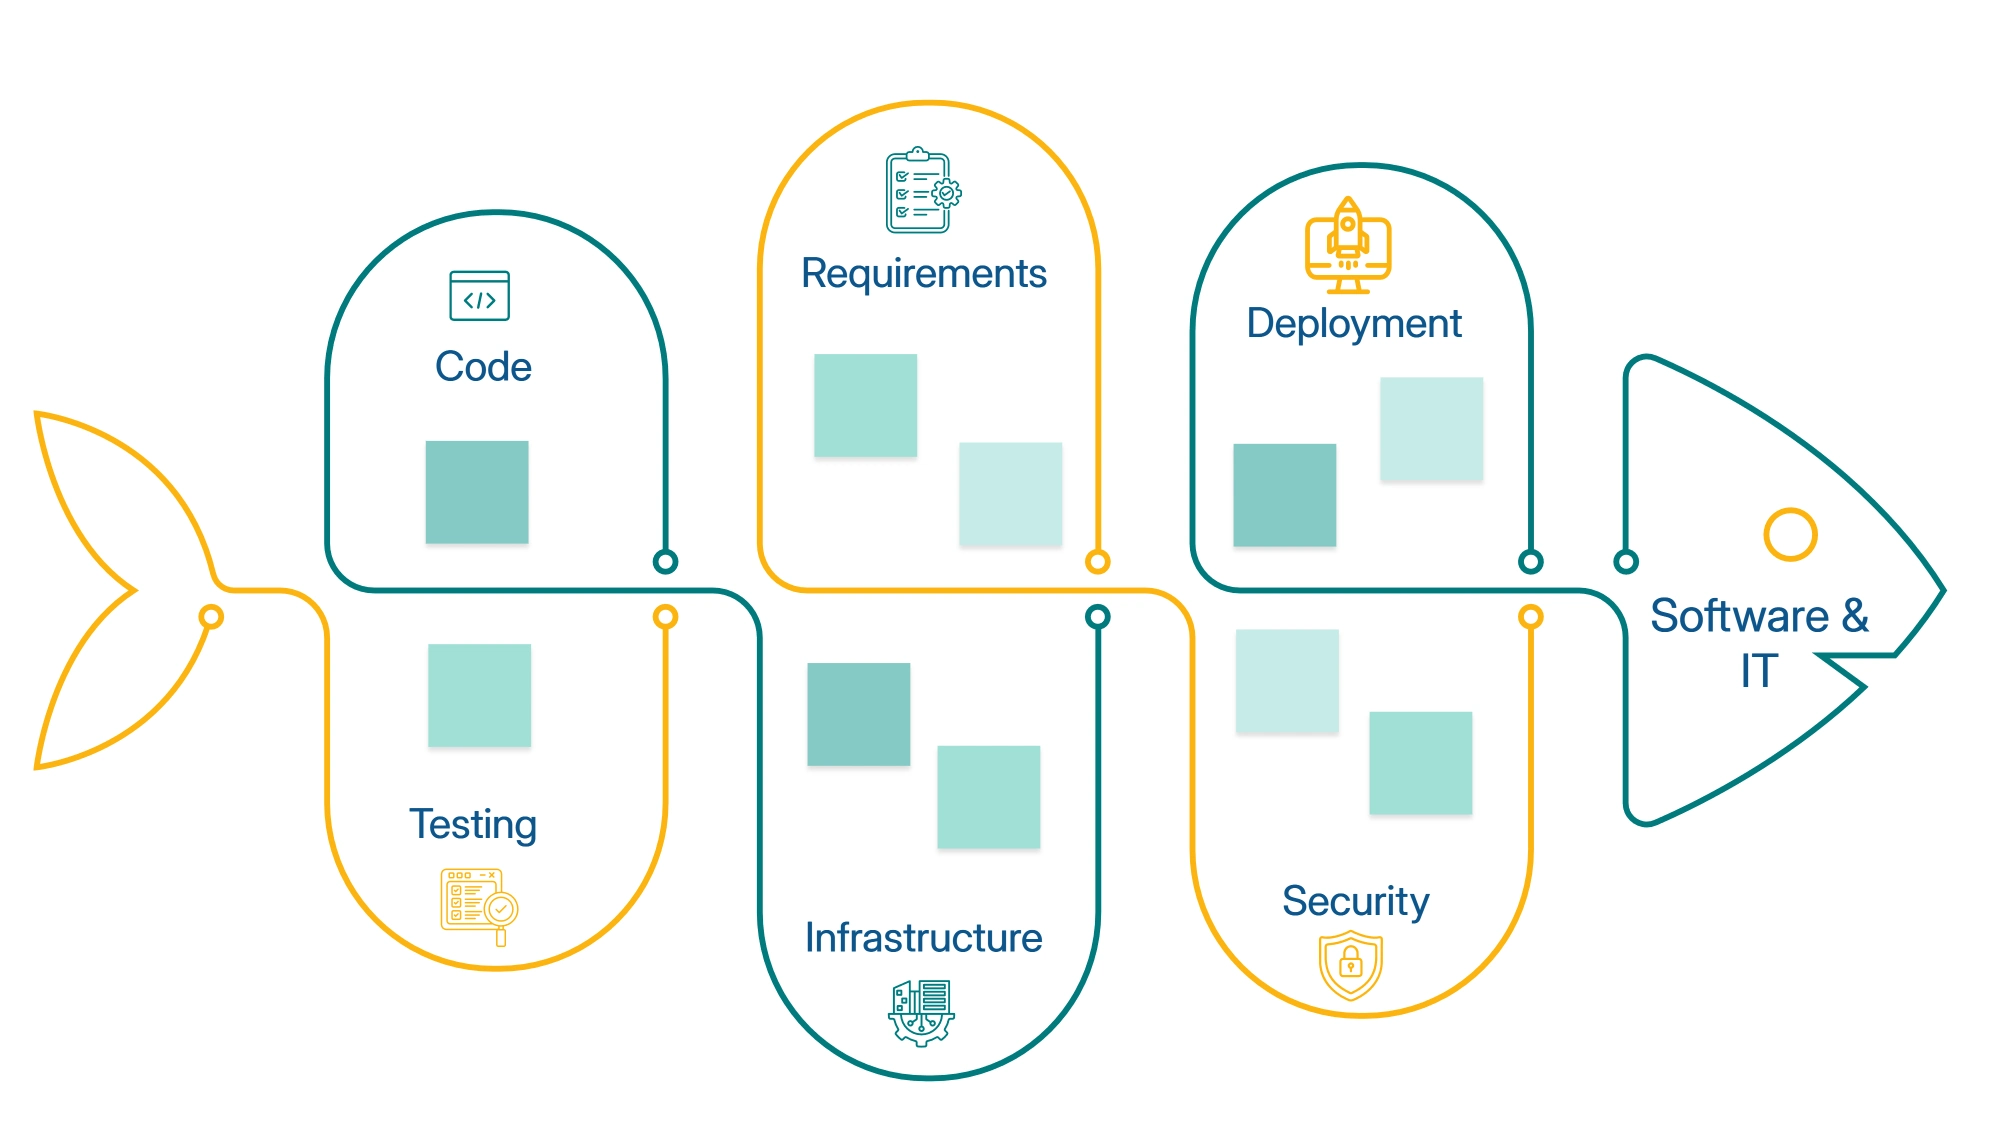
Eyes tech bugs and system snags.
Categories include:

  • Code
  • Infrastructure
  • Requirements
  • Testing
  • Deployment
  • Security
    Software & IT Ishikawa Diagram

When Should You Use an Ishikawa Diagram?

Grab an Ishikawa diagram when problems pop up that need a clear team look. It shines best for tough spots where quick fixes just won't cut it. This tool turns confusion into smart action fast.

Key Times to Use It

Use an Ishikawa diagram when:

  • A problem keeps coming back again and again
  • The real root cause hides and stays unclear
  • Many factors team up to make one big issue
  • Your group needs a fun brainstorm push
  • You aim to tweak and boost a process

Extra Strong Moments

It works extra well during:

  • Quality audits to check deep work flows
  • Incident probes after something goes wrong
  • Process tune-up projects for smooth runs
  • Team retrospectives and after-action chats

Benefits of Creating an Ishikawa Diagram

Making an Ishikawa diagram brings big wins that last for teams in all kinds of work. It turns messy problems into clear plans everyone gets. Long-term perks show up in better fixes and smoother days.

Key Benefits

  • Clarifies complex problems visually so all see the full picture fast.
  • Identifies root causes instead of symptoms to stop guesswork.
  • Improves team collaboration and engagement with shared brainstorms.
  • Supports structured brainstorming for fresh, full ideas.
  • Reduces process variation and errors for steady work flows.
  • Enhances quality control and compliance with clear checks.
  • Prevents recurring failures by hitting true fixes.
  • Improves decision-making accuracy with fact-based views.
  • Saves time and resources on smart picks.
  • Strengthens continuous improvement efforts like Lean and Six Sigma.

What Are the Best Tools for Creating Ishikawa Diagrams?

The right tool speeds up clean Ishikawa diagrams and boosts team work. Top picks include Lucidchart, Microsoft Visio, Miro, Canva, and draw.io for easy builds. Cloudairy stands out as the top choice for simple, smart use.

Why Cloudairy Is the Best Tool for Ishikawa Diagrams

Cloudairy fits busy teams who crave clear tools without extra fuss. It turns root cause hunts into quick wins.

Key Features

  • AI-assisted diagram creation to spark ideas fast.
  • Ready-to-use Ishikawa diagram template for instant starts.
  • Drag-and-drop interface anyone can handle.
  • Real-time collaboration so teams edit live.
  • Clean, professional layouts that look sharp.
  • Easy export in PNG, PDF, or SVG formats.
  • Cloud-based access from any spot.

Cloudairy shines for production bugs or work flow fixes, making root cause analysis easy and strong.

Ishikawa Diagram Templates & Examples

Templates speed up Ishikawa diagram work for teams. They keep things neat and matching across uses. Start quick and tweak to fit any issue right away.

Popular Ishikawa Diagram Examples

  • Manufacturing defect analysis to spot factory flaws.
  • Customer complaint root cause to fix service gripes.
  • Website downtime investigation for tech crash checks.
  • Software bug analysis to hunt code errors.
  • Delivery delay investigation for shipping snags.
  • Employee performance issues to boost staff work.
  • Sales drop analysis to lift business numbers.
  • Healthcare incident review for patient safety digs.
  • Supply chain disruption to smooth vendor flows.
  • Quality audit findings for process clean-ups.

With Cloudairy, tweak these templates in seconds to match your exact problem.

FAQs:

What is an Ishikawa diagram?

An Ishikawa diagram is a visual tool used to identify and organize the root causes of a problem by mapping cause-and-effect relationships.

Why is it called a fishbone diagram?

Its structure resembles a fish skeleton, with causes branching off a central spine toward the problem.

What industries use Ishikawa diagrams?

Manufacturing, healthcare, IT, education, business operations, and quality management.

What are the common Ishikawa categories?

The most common are the 6M categories: Man, Machine, Method, Material, Measurement, and Environment.

What is the best tool for creating Ishikawa diagrams?

Cloudairy is one of the best tools due to its templates, AI assistance, collaboration features, and ease of use.

Ready to create smarter with AI?

Start using Cloudairy to design diagrams, documents, and workflows instantly. Harness AI to brainstorm, plan, and build—all in one platform.

Keep Reeding

View all arrow-right
Organizational Chart

What is an Organizational Chart?

Read now
What Is a Concept Map?

What Is a Concept Map: Definition, Types, and Guide

Read now
What Is an Ishikawa Diagram

What Is an Ishikawa Diagram?

Read now