Technical Diagramming
Fishbone Diagram: Identify Root Causes Visually


AI Workspace for Diagrams & Collaboration
Get your team started in minutes
Sign up with your work email for seamless collaboration.
The Fishbone Diagram, which is also known as the Ishikawa Diagram or the Cause and Effect Diagram, is the most powerful tool among all problem-solving techniques for root cause analysis. By using the diagram, teams can investigate all factors including the less visible ones that are contributing to the problem rather than restricting their analysis to the apparent symptoms only.
In case you are dealing with the continuous quality issue, customer complaints, or operational delays, the visual method can facilitate your team in a better understanding of the problem and thus be able to take data-driven corrective actions together with the team.
The Fishbone Diagram Template is at your disposal for immediate usage, or you may make one of your own with the help of the Workflow & Process Diagram Maker.
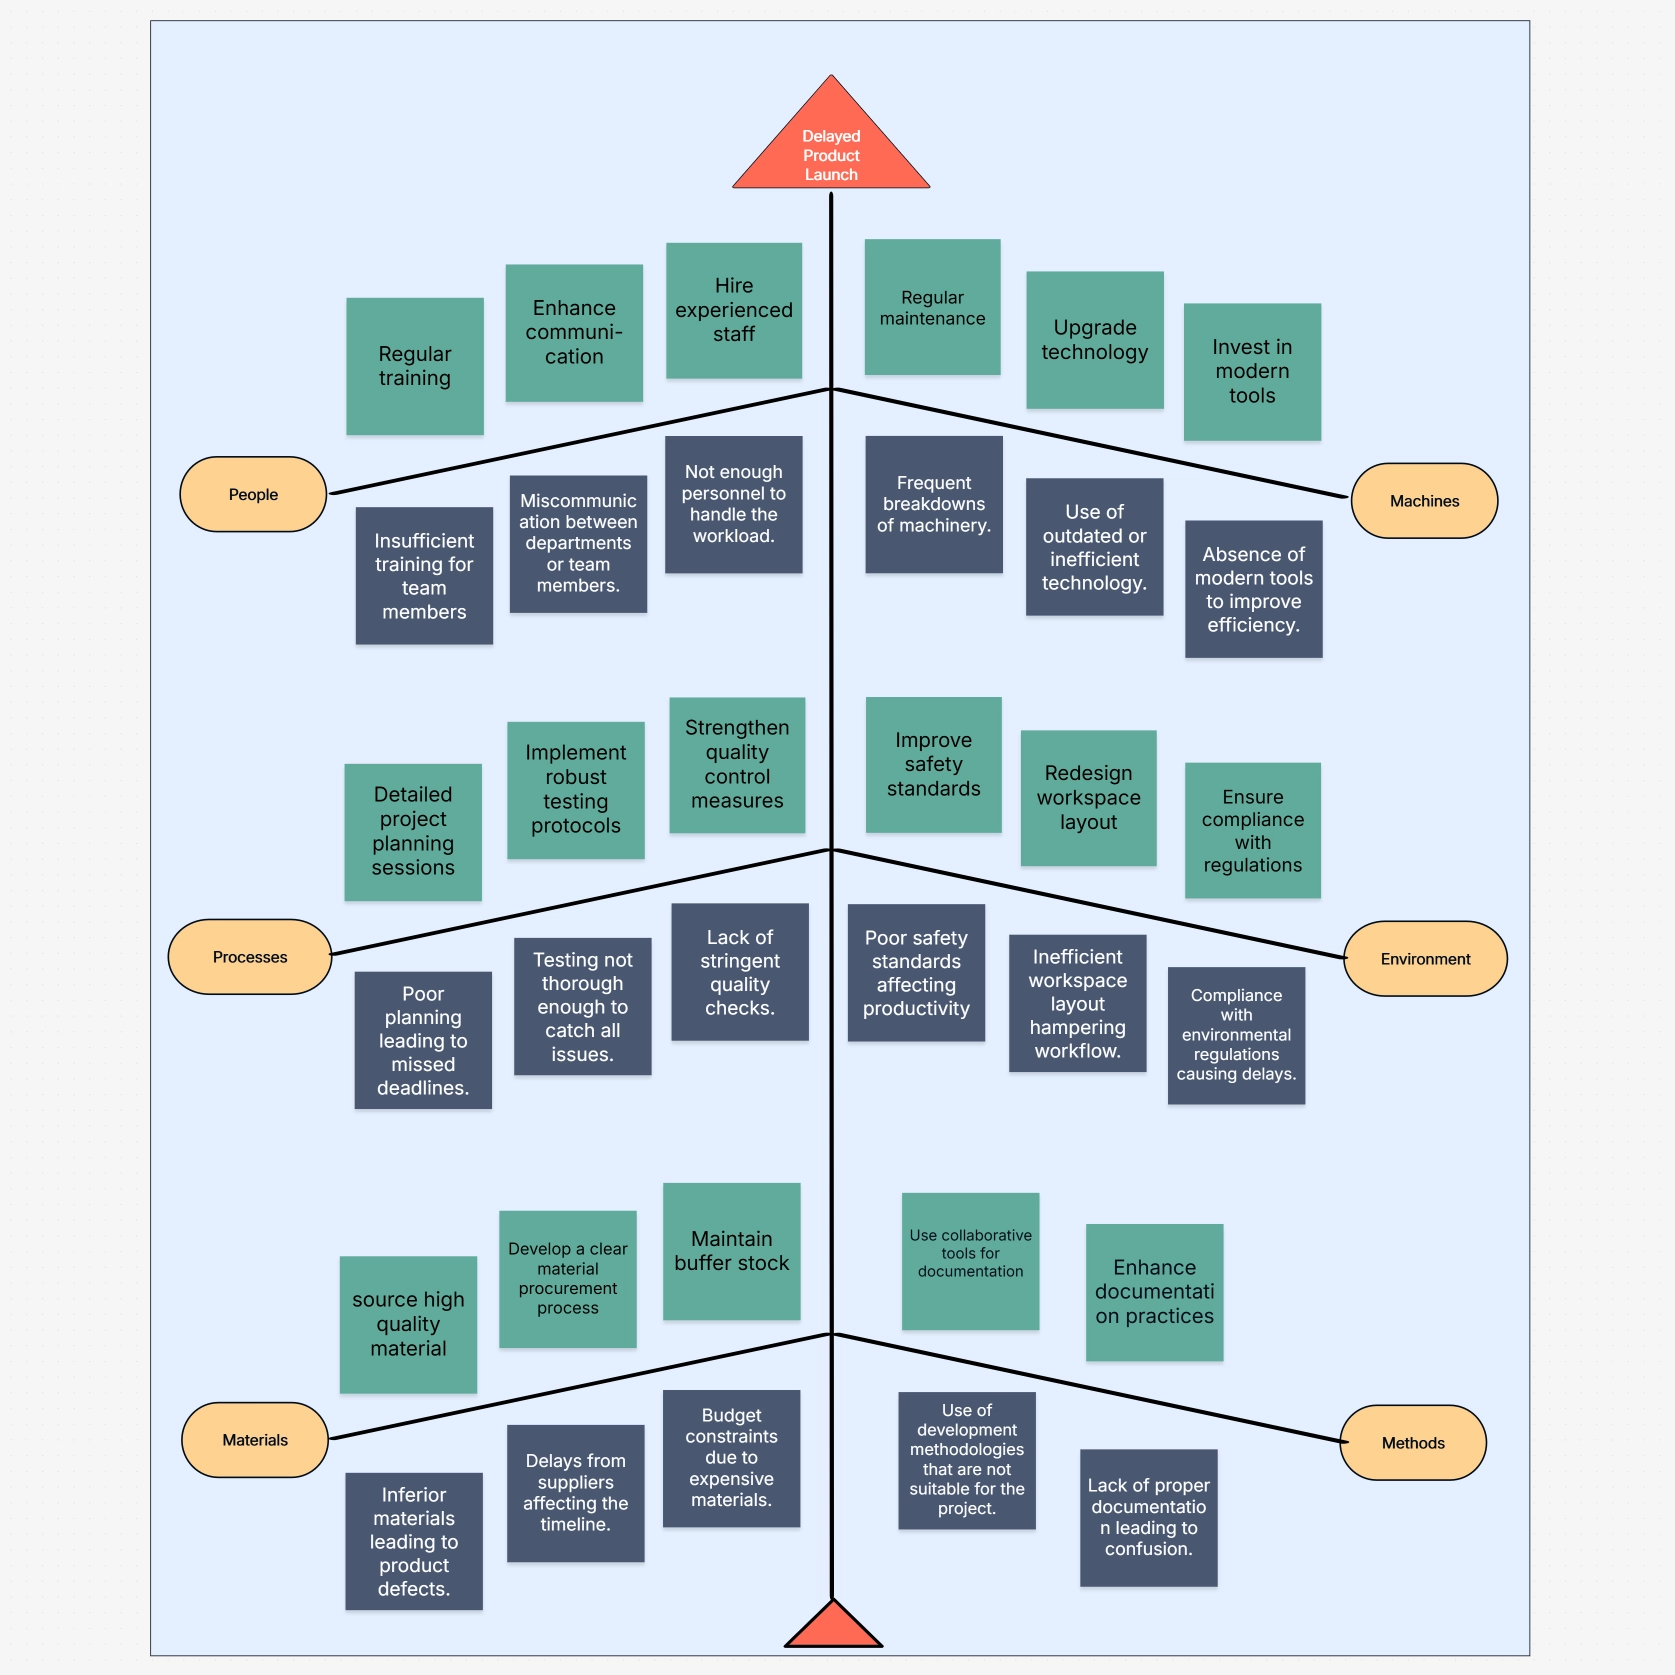
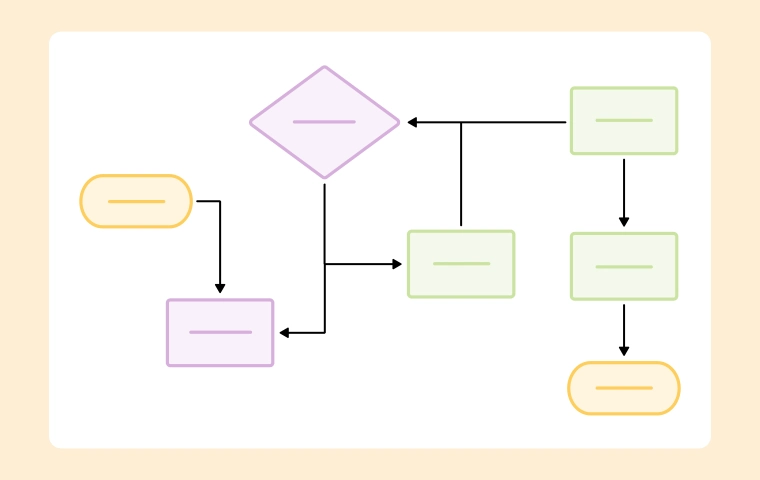
A Fishbone Diagram organizes potential causes of a problem into categories that “branch” from the main issue, forming
a structure that resembles a fish skeleton. The “head” represents the problem statement, while each “bone”
corresponds to a cause category such as People, Methods, or Equipment.
This
method encourages teams to dig deeper into all contributing factors — helping ensure that the true cause is
uncovered before implementing a fix. It’s a cornerstone technique for Lean, Six Sigma, and Total Quality
Management (TQM) practices.
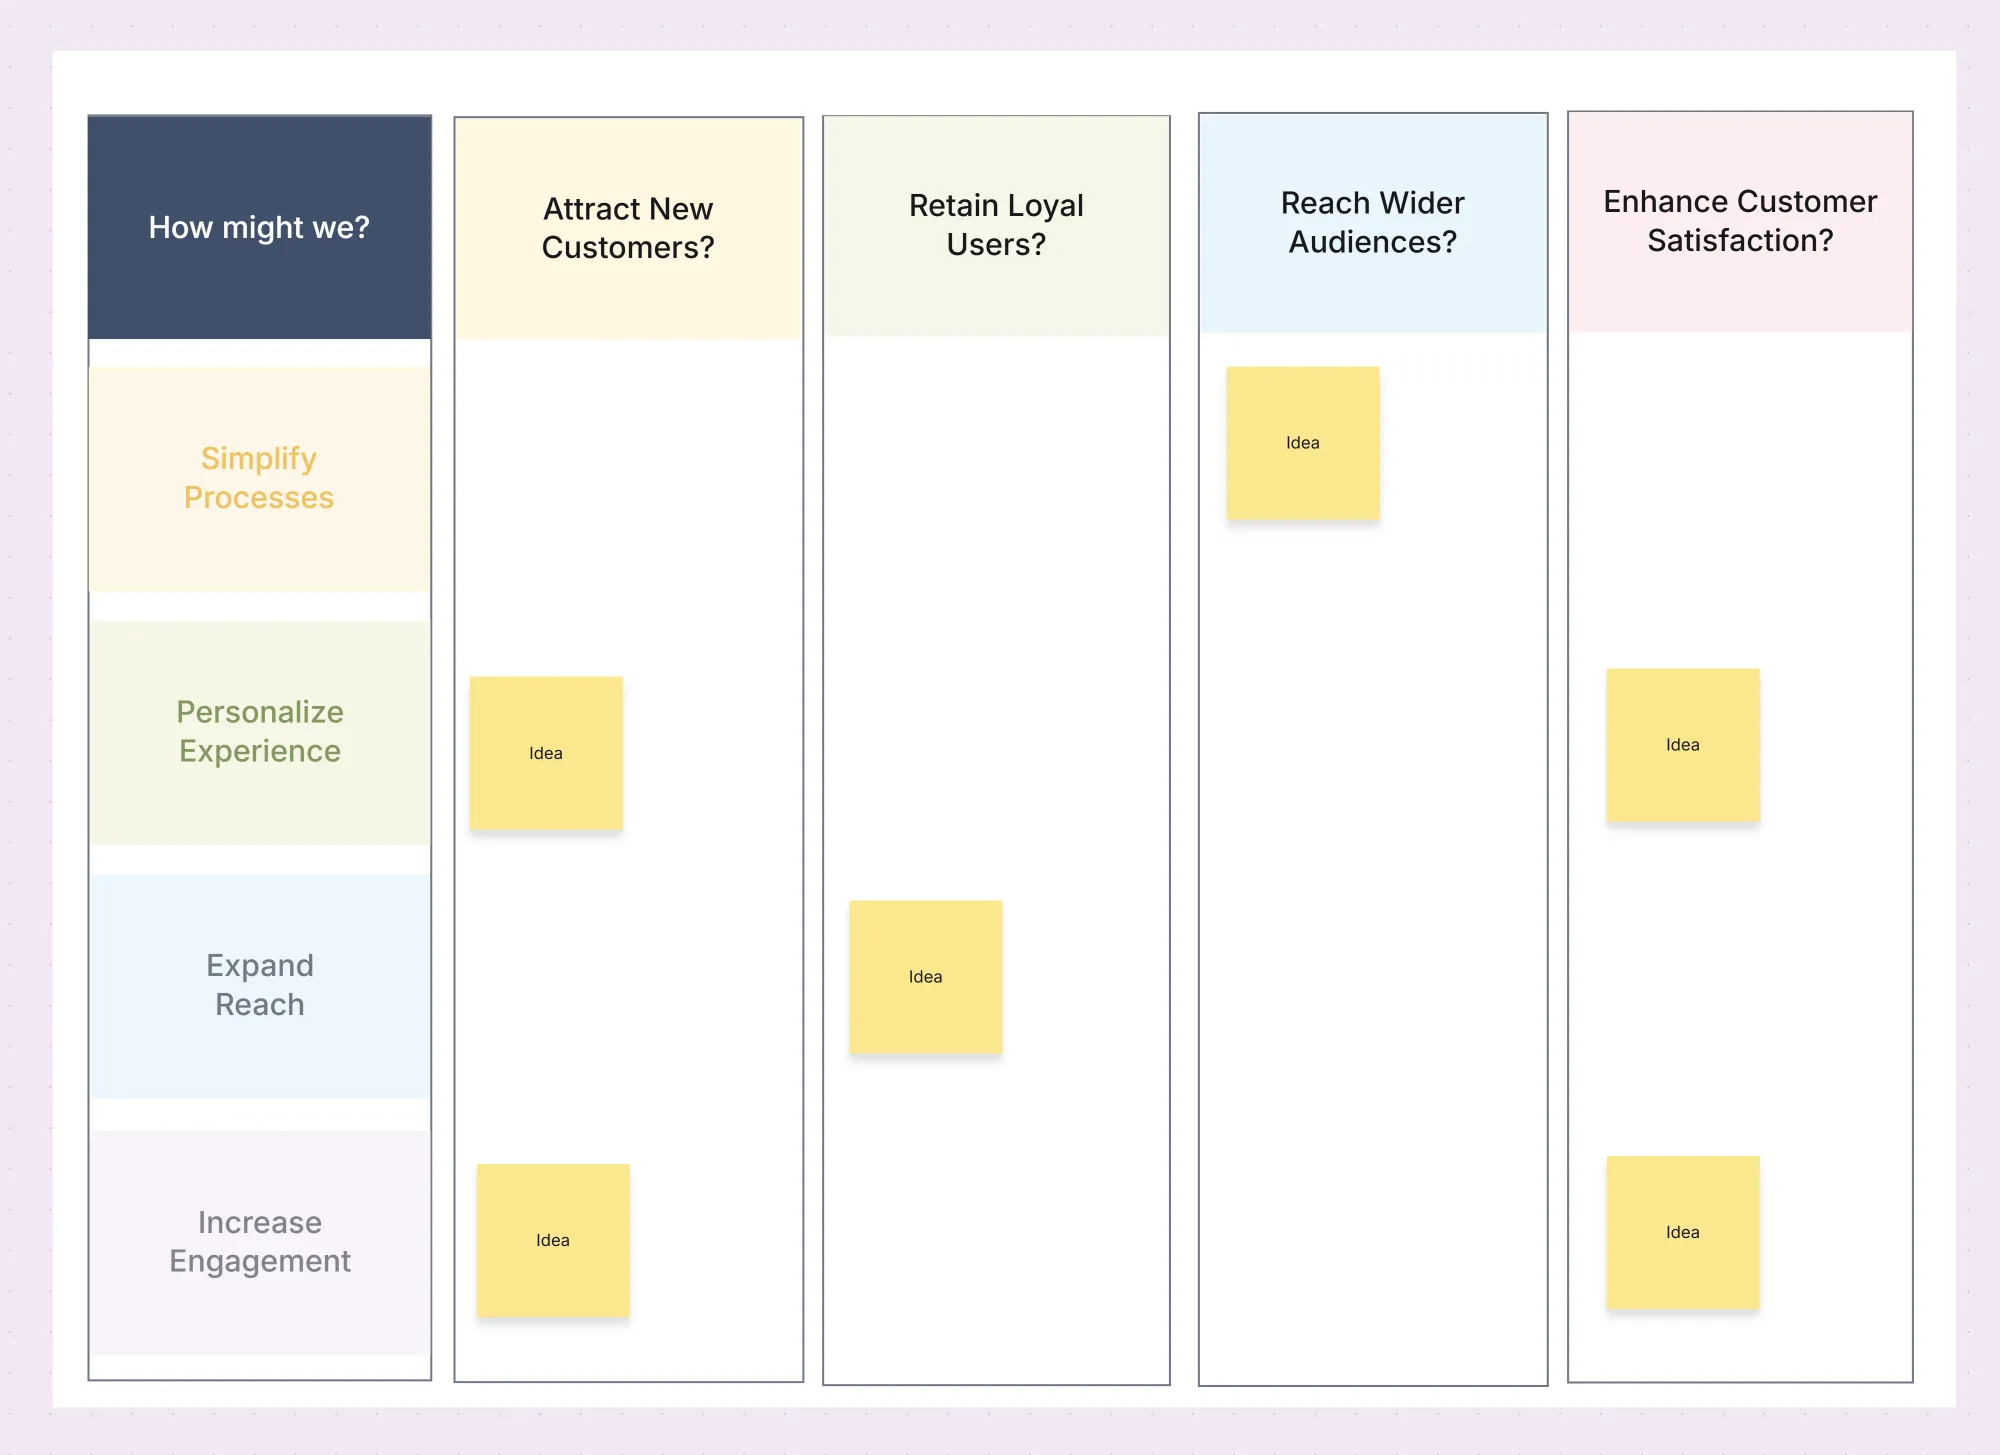
Fishbone diagrams do not only bring order but also enhance the quality of brainstorming sessions and are therefore considered a must-have tool for quality and performance improving teams. They change unstructured conversations into a defined and illustrated scrutiny that includes all the factors affecting the issue.
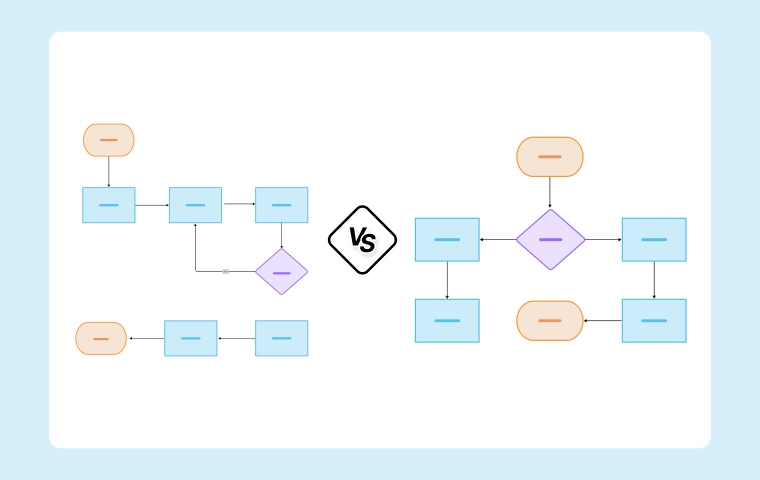
The 6M framework is the most common one for the construction of Fishbone Diagrams, which was initially intended for the manufacturing sector but later on, it found application in numerous industries.
You may utilize the Fishbone Diagram Template to customize or enlarge these categories according to your industry — for instance, using “Software,” “Policy,” or “Customer Factors” in the IT or service sectors.
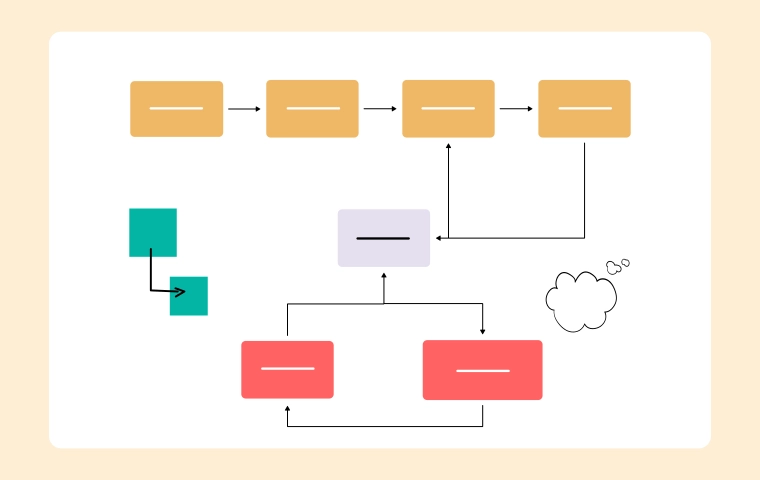
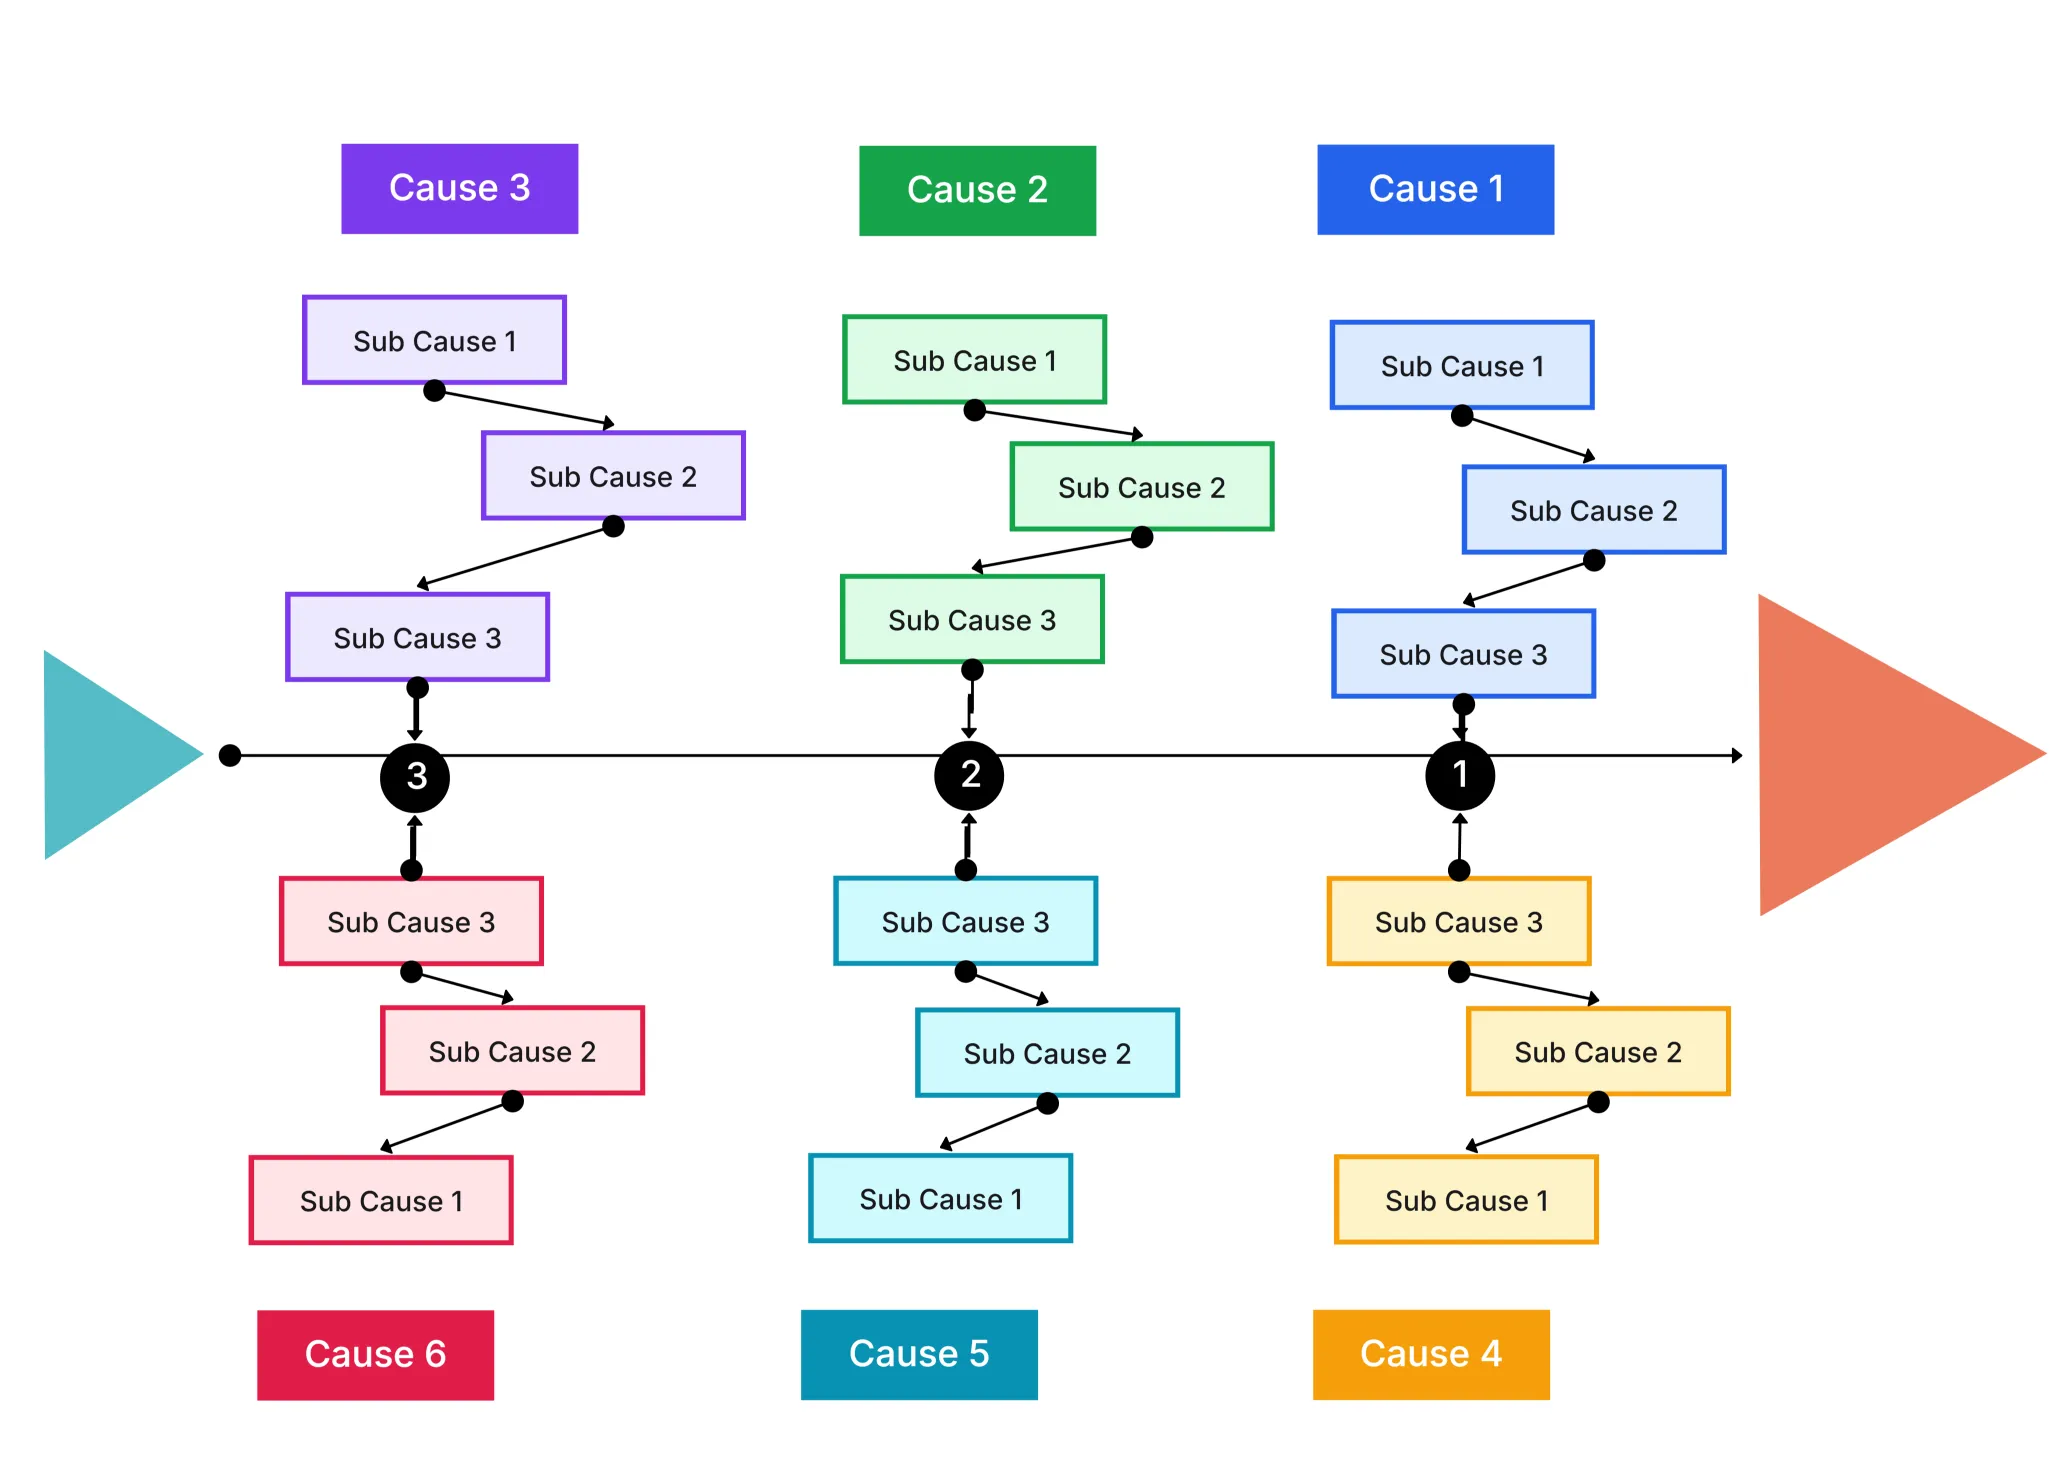
Building a Fishbone Diagram is a structured process that combines data collection, brainstorming, and analysis. Each step helps uncover hidden relationships between causes and effects.
Try the Workflow & Process Diagram Maker to generate professional, editable Fishbone Diagrams effortlessly.
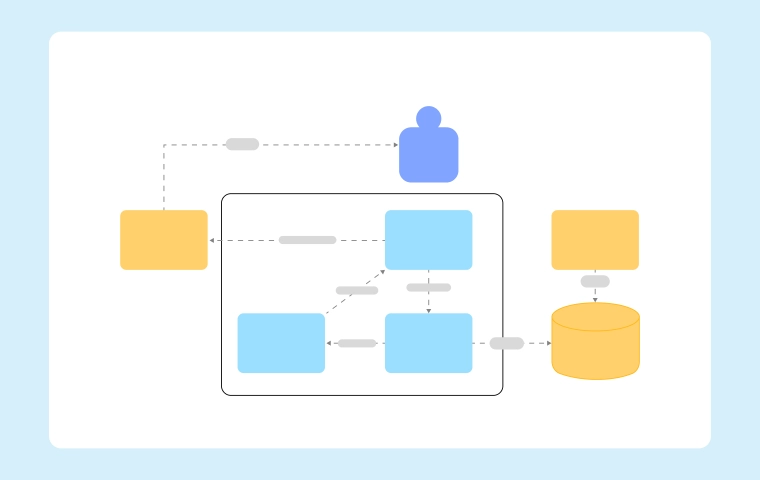
Fishbone Diagrams are applied across industries wherever structured problem-solving and continuous improvement are priorities.
The Fishbone Diagram stays to be one of the most productive and teamwork-oriented methods to reveal root causes in any work. It provides a clear structure, and visibility, and co-participation in the solution to the problem, thus, advancing the organizations from the defeat of recurring problems to the establishment of the new improvements.
You can begin graphically exploring your processes with the Fishbone Diagram Template and create high-quality root cause diagrams in less than 10 minutes with the help of the Workflow & Process Diagram Maker. For further insight, please refer to the Workflow & Process Diagrams Guide blog.
Start using Cloudairy to design diagrams, documents, and workflows instantly. Harness AI to brainstorm, plan, and build—all in one platform.
Table of Contents

Introduction
 Manage all your work in one placeCollaborate with your teamUse Cloudairy for FREE—forever


 Related Articles
.webp)