AI Fishbone Diagram Generator
AI Fishbone Diagram Generator — Root Cause Analysis in Seconds
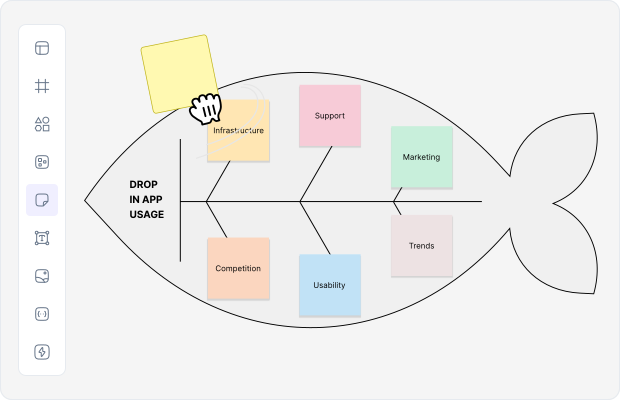
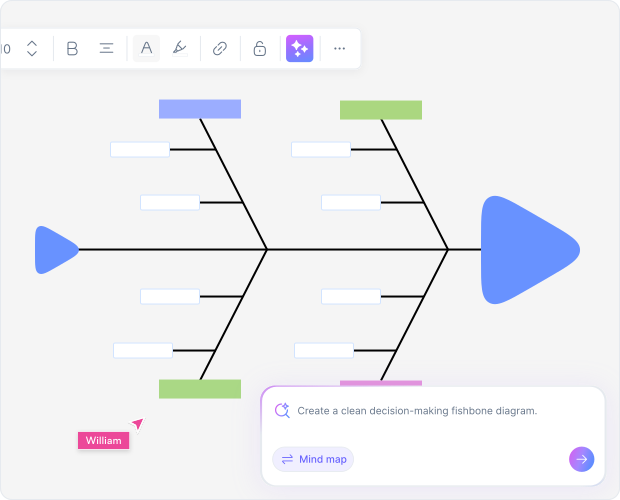
Transform complex quality problems into clear, visual fishbone diagrams in seconds. Cloudairy's AI fishbone diagram generator takes your written description and automatically creates professional Ishikawa diagrams that identify root causes instantly. Whether you're analyzing manufacturing defects, service failures, or process inefficiencies, our AI structures your analysis visually.
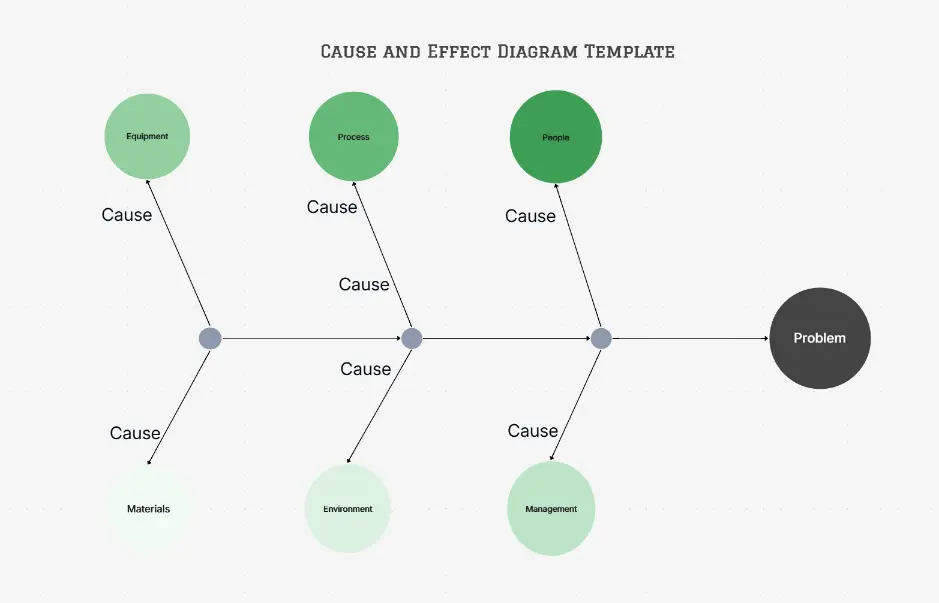
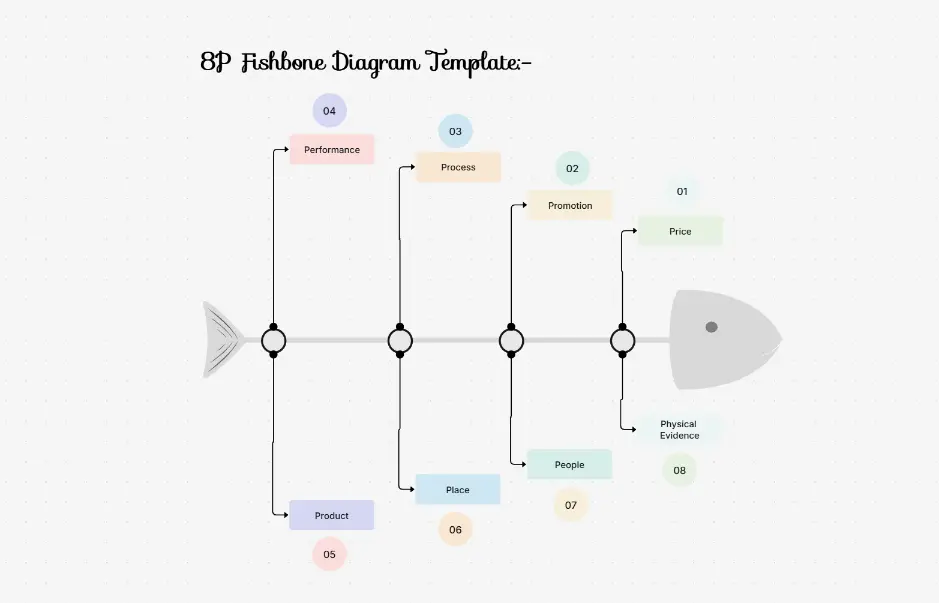
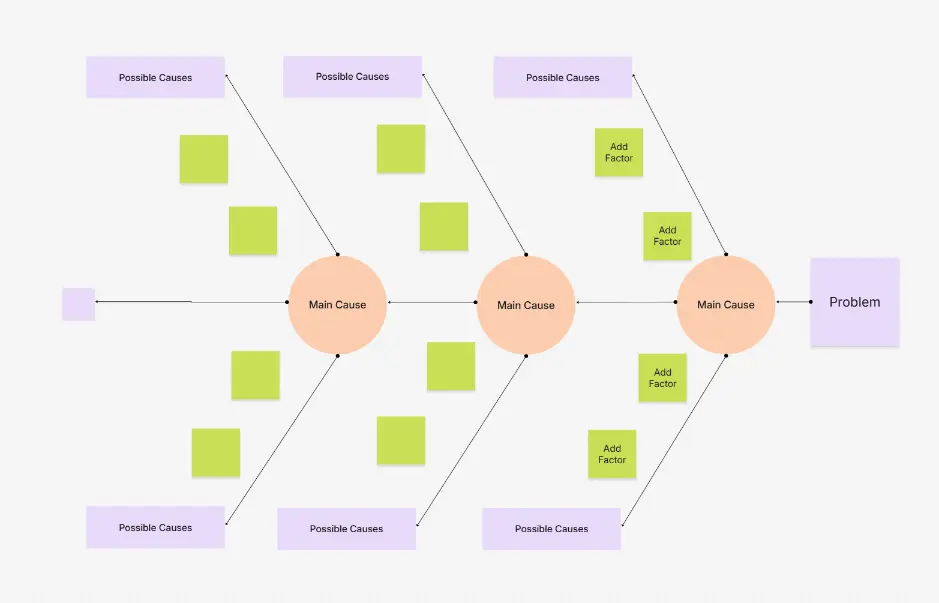
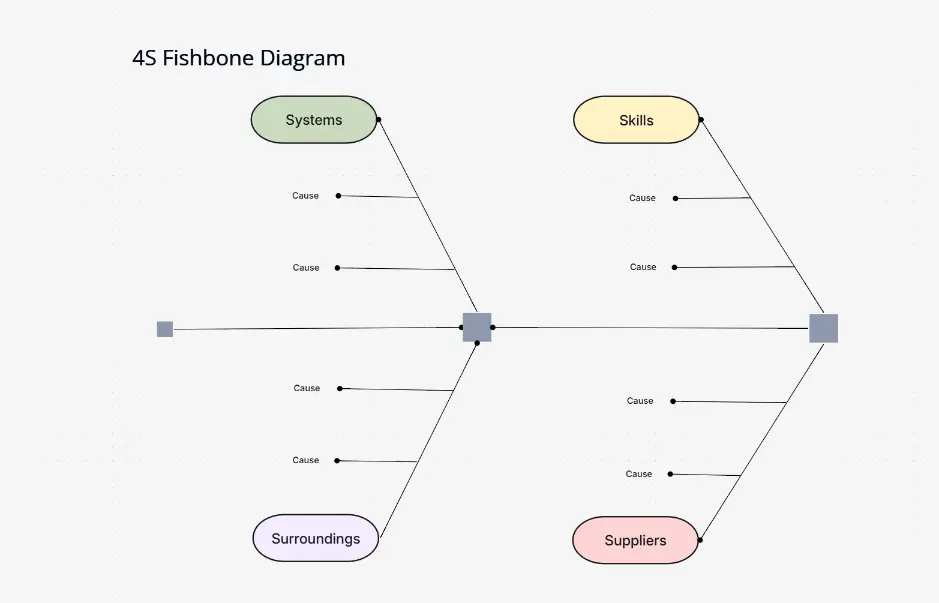
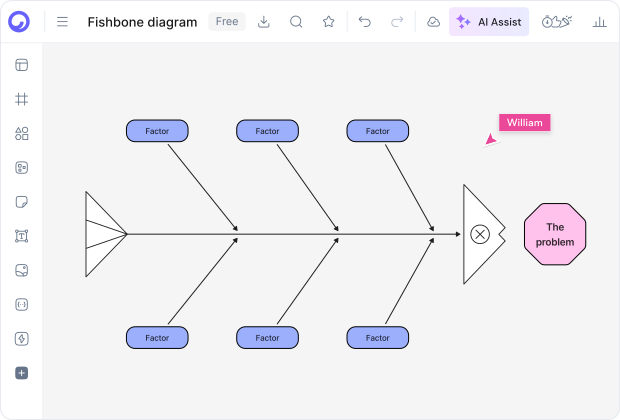
Create professional Ishikawa diagrams from text descriptions — just describe the problem
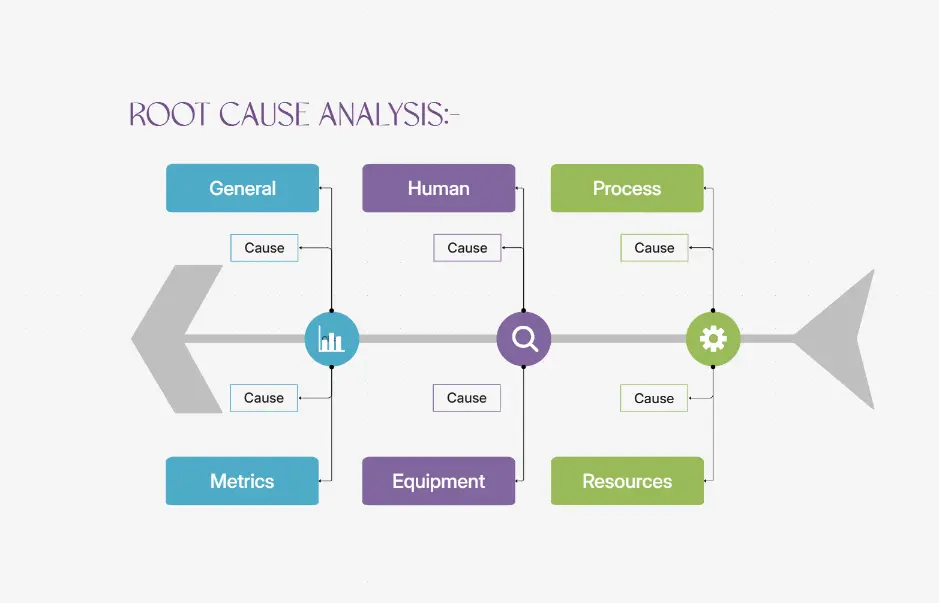
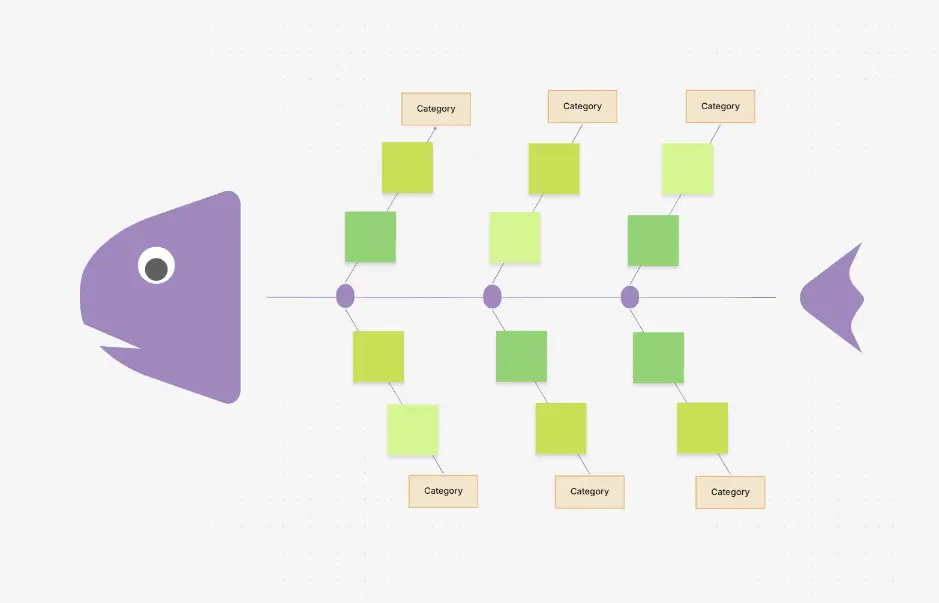
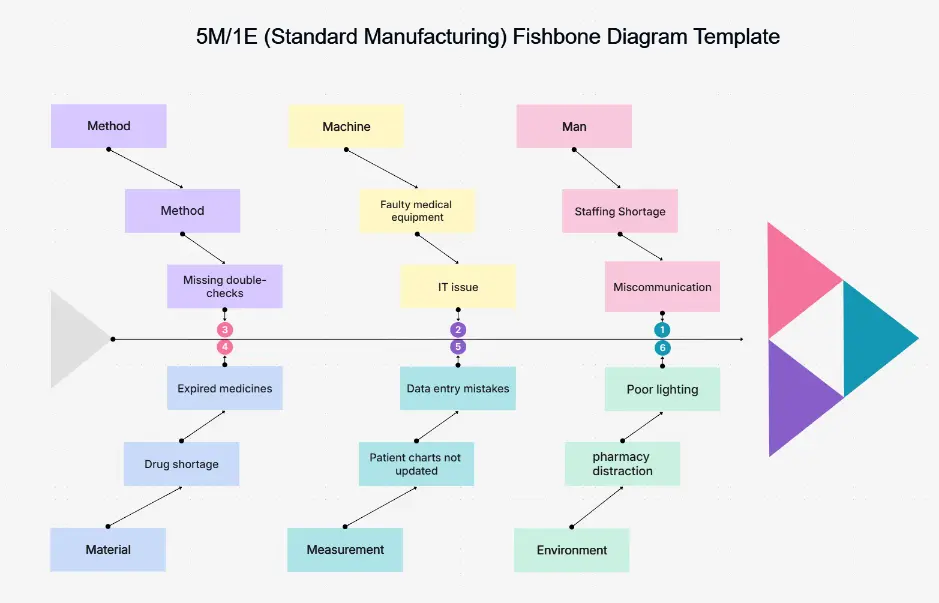
AI identifies cause categories (6M, 4M), branches, and root causes automatically
Export fishbone diagrams as PNG, SVG, or PDF for presentations and quality reports