hero-bg-pricing

Get your team started in minutes

Sign up with your work email for seamless collaboration.

IT Organizational Chart
Org Chart

IT Organizational Chart: Roles & Structure Explained

Author
Cloudairy
By Cloudairy Team
January 10, 2026
10 min read

An IT organizational chart is of utmost importance as technology has become the backbone of all processes, products, and customer interactions. When roles and reporting lines are not clearly designated, this results in the slowing down of projects, increase in the risk of security issues and the formation of knowledge silos. The chart clarifies who is in charge, defines the cooperation among engineering, infrastructure, and support and speeds up the decision-making process. It also assists in the justification of the establishment of the necessary number of employees, the ranking of the roadmaps by priority, and the alignment of the budgets with the overall strategy. Discover the IT Organizational Chart Template that can be edited along with the wider context in the Industry Pillar for a robust start.

What Is an IT Organizational Chart?

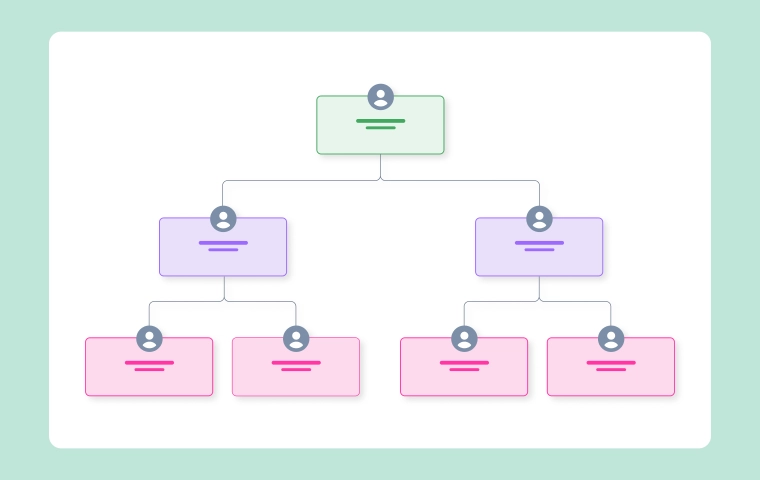
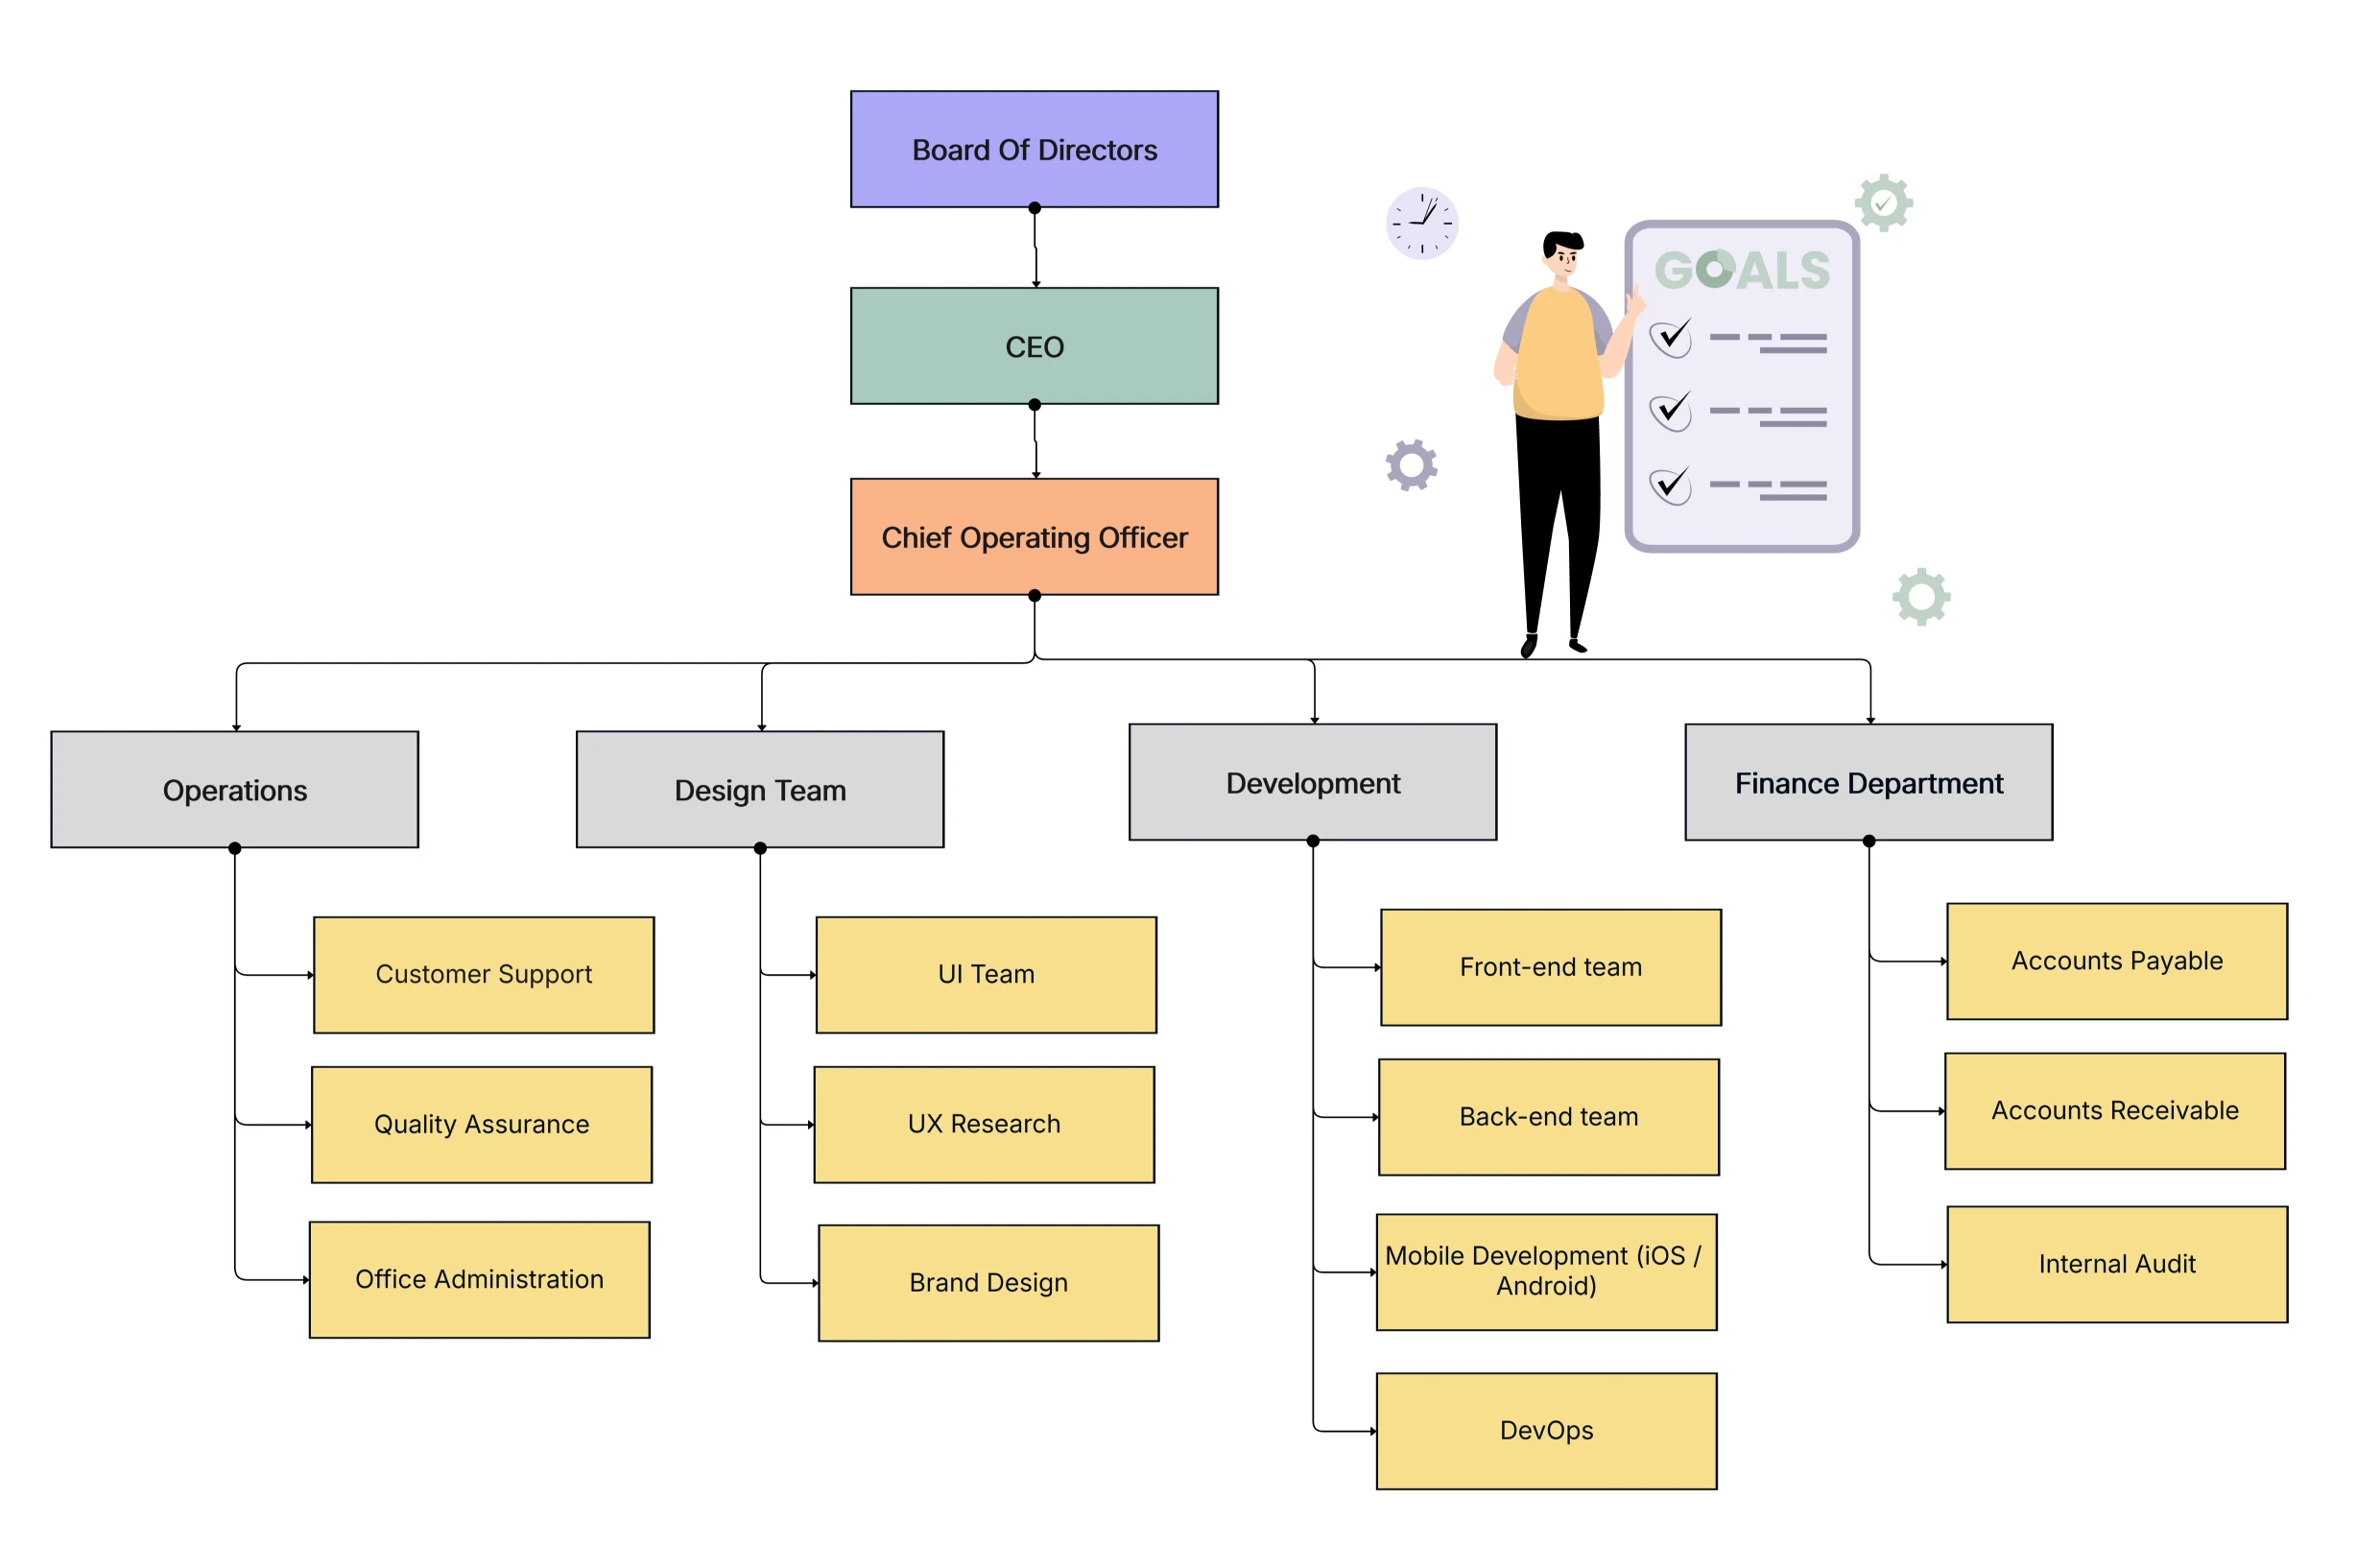
An IT organizational chart visual representation that reveals the combination of tech teams such as—that are composed of leadership, managers, specialists, and cross-functional partners. It shows the division of responsibilities for product engineering, data, cloud, cybersecurity, quality, and IT service delivery. Each team has its own roles and responsibilities, and the structure distributes business ambiguity, accelerates escalations, and supports the communication of who is responsible for each area like uptime, reliability, and innovation. It also facilitates holding audits and vendor oversight. You can compare approaches with the Company Organizational Chart Templateand create your layout inside the Industry Org Chart Maker.

See below for the core elements every IT organizational chart should include.

  • Executive Leadership & Architecture: Show the CIO/CTO and enterprise architects who translate business strategy into technology roadmaps. This layer aligns funding, sets standards, and coordinates platform decisions, ensuring teams work on the right problems and reuse capabilities instead of rebuilding tools across silos repeatedly.
  • Product & Engineering Delivery: Capture VPs, directors, and managers across front-end, back-end, platform, QA, and DevOps. Clear reporting clarifies sprint commitments, reliability targets, and handoffs between building, testing, and deploying—minimizing rework and improving time-to-value for internal stakeholders and external customers.
  • Infrastructure, Cloud & Data: Map ownership for networks, endpoints, cloud landing zones, SRE, data engineering, and analytics. Visibility prevents gaps in resilience, backup, and observability, while clarifying guardianship of cost optimization, data quality, and performance across shared environments that underpin all digital services.
  • Security, Risk & Support: Include the CISO, security operations, GRC, and IT service desk. This ensures everyone understands incident paths, change approvals, and user-support SLAs. It also improves audit readiness by showing who owns policies, controls, and response plans when threats or outages occur.

Core Roles in an IT Organizational Structure

A robust IT organizational structure blends strategic leadership with operational depth. Distinct role definitions prevent decision bottlenecks and enable distributed execution. Visible ownership of platforms, data, and security reduces downtime and strengthens compliance. This clarity is vital when you scale hybrid work, SaaS portfolios, and product teams. Use the IT Organizational Chart Template alongside the Project Organizational Chart Template to coordinate delivery and governance effectively.

See below for the pivotal roles to feature in your IT organizational chart.

  • CIO / CTO & Enterprise Architects: The CIO/CTO sets strategy; architects define standards and modernization paths. Together, they steer investments, lifecycle policies, and platform consolidation. Their leadership balances innovation with risk, ensuring technology choices align with customer outcomes, cost targets, and long-term sustainability across teams.
  • VP/Director of Engineering & Product Leaders: They convert strategy into roadmap increments and quality gates. By orchestrating squads and platforms, they maintain velocity and reliability. Their span includes capacity planning, hiring, vendor selection, and alignment with business owners, turning vision into shipping software predictably and transparently.
  • Head of Infrastructure / SRE Lead / Data Lead: This triad safeguards stability. They own networks, cloud foundations, observability, backups, and data pipelines. Clear charts reduce finger-pointing during incidents and highlight owners for resilience, performance budgets, and analytic readiness—critical for AI and reporting initiatives.
  • CISO / Head of IT Operations & Service Desk: Security and operations leaders enforce controls, manage identity, and run support. By visualizing escalation paths, change windows, and incident roles, organizations cut MTTR, improve adoption, and meet compliance while maintaining strong employee experiences across devices and apps.

Common IT Organizational Chart Models

Your IT org structure should mirror business strategy, complexity, and risk tolerance. Some teams centralize to standardize platforms; others embed technologists into business units for speed. Many adopt a hybrid to combine consistency with agility. Explore model-specific templates in the IT Organizational Chart Template and trend insights in the Industry Report.

See below for three widely used IT organizational chart models.

Centralized IT Organizational Structure

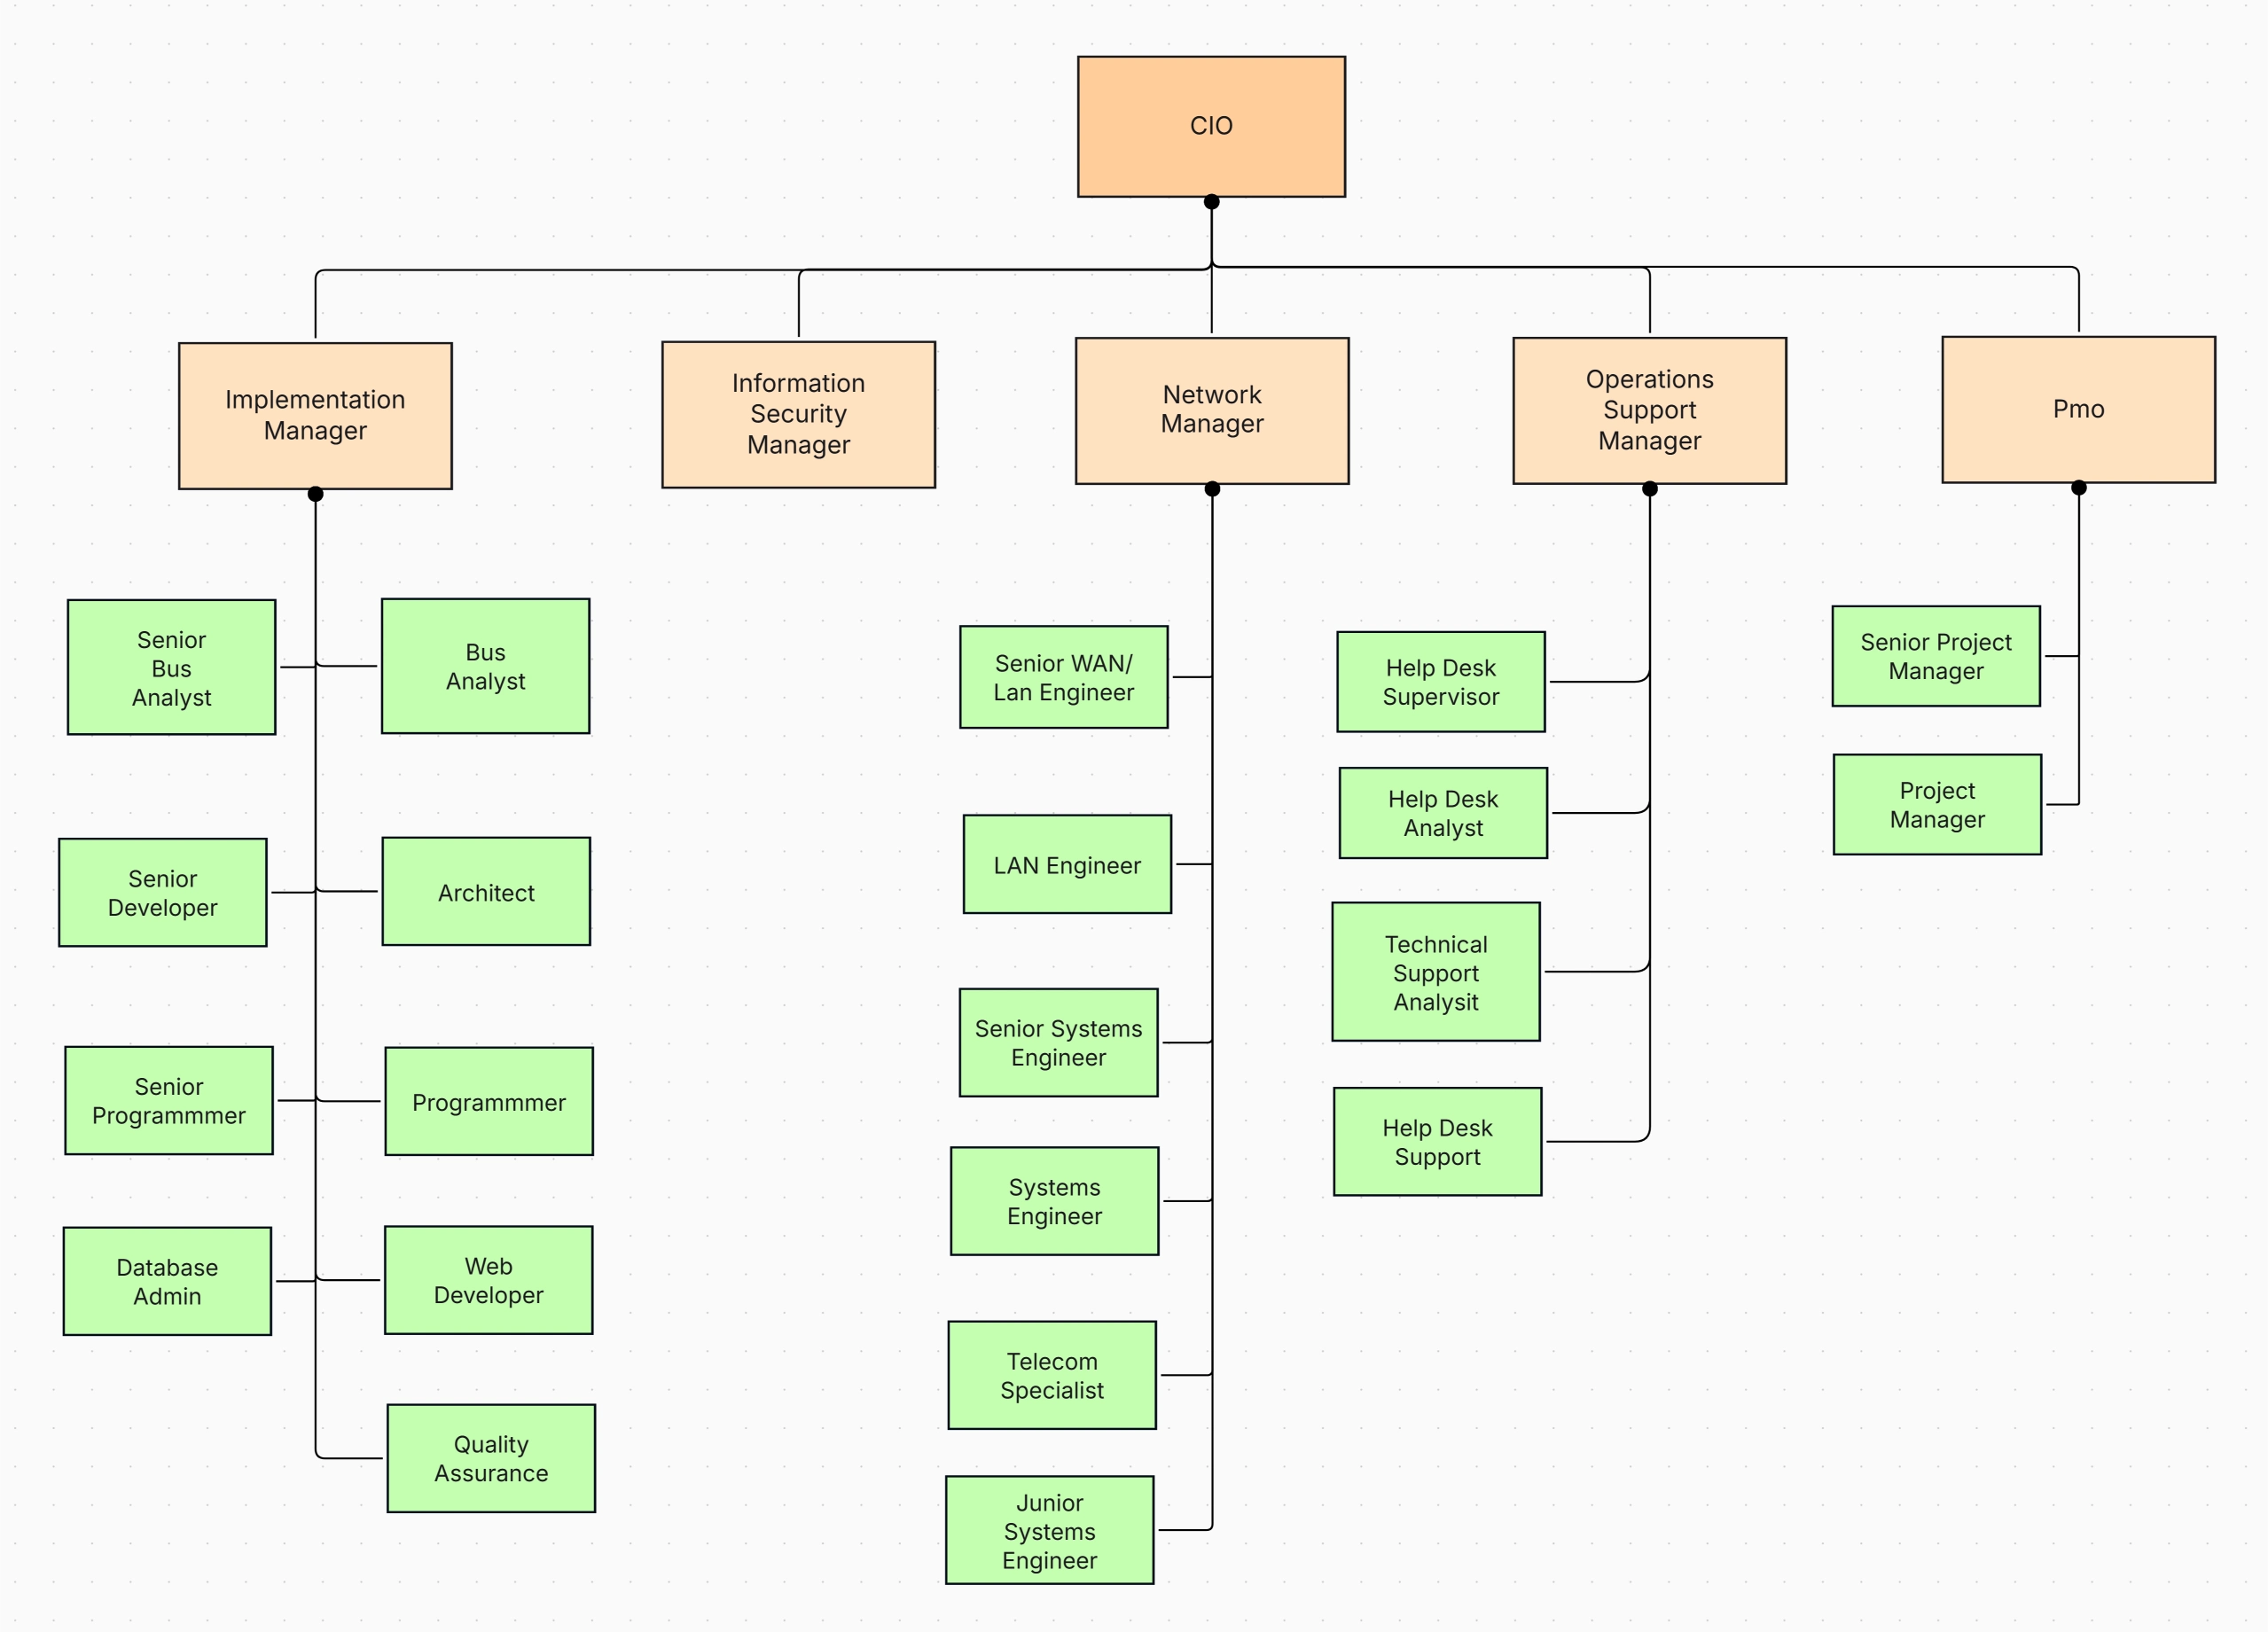
A centralized IT organizational structure consolidates technology under a single CIO with shared services—architecture, platforms, and security. This improves governance, reduces tool sprawl, and enables economies of scale. It works well where risk is high and compliance is strict. Visual standards and reusable platforms accelerate delivery. Compare with enterprise patterns in the Corporate Template.

  • Strengths: Standardized tooling, contracts, and processes reduce cost and risk. Central intake clarifies priorities, while shared reference architectures speed onboarding. Security controls become consistent, audits simpler, and disaster recovery cohesive, improving resilience across locations, clouds, and vendors simultaneously.
  • Watch-Outs: Innovation can slow when business units wait in queue. Product teams sometimes feel distant from decision-makers. Mitigate by delegating platform product owners, publishing roadmaps, and reserving capacity for experiments so local needs still move forward without bypassing governance.

Decentralized or BU-Embedded IT Structure

A decentralized IT organizational chart embeds technologists in each business unit. Teams move quickly, tailor solutions, and iterate with domain experts. This model thrives in diverse product portfolios or regional markets. Shared guardrails still matter identity, logging, data, and security patterns must remain consistent. See cross-industry examples in the Pillar Page.

  • Strengths: Faster decisions and domain intimacy improve feature fit. BU leaders directly prioritize technology with revenue lines, increasing accountability. Local teams experiment safely, then fold back proven patterns, enabling a portfolio of innovations rather than a single monolith that fits no team particularly well.
  • Watch-Outs: Tool sprawl, duplicated integrations, and fragmented data arise quickly without platform standards. Establish a lightweight architecture council, golden paths, and cost transparency to protect security, budgets, and interoperability while preserving BU autonomy and speed.

Matrix IT Organizational Structure

A matrix IT organizational structure combines centralized platform ownership with embedded product teams. Staff report to a functional leader (skills) and a product/program leader (outcomes). It suits organizations scaling product models while protecting shared services. Get a blueprint in the Matrix Template and coordinate delivery via the Project Template.

  • Strengths: Balances reuse and responsiveness. Functional leaders grow capabilities and careers; product leaders deliver outcomes. This dual lens reduces silos and ensures consistency in security, data, and operations, even as squads move quickly across markets and customer segments.
  • Watch-Outs: Dual reporting confuses priorities without clear OKRs. Publish RACI, sprint cadences, and escalation rules. Align budgets to both platform health and product value, preventing “shadow platforms” that silently diverge from standards and jeopardize reliability at scale.

How to Build an IT Organizational Chart (Step-by-Step)

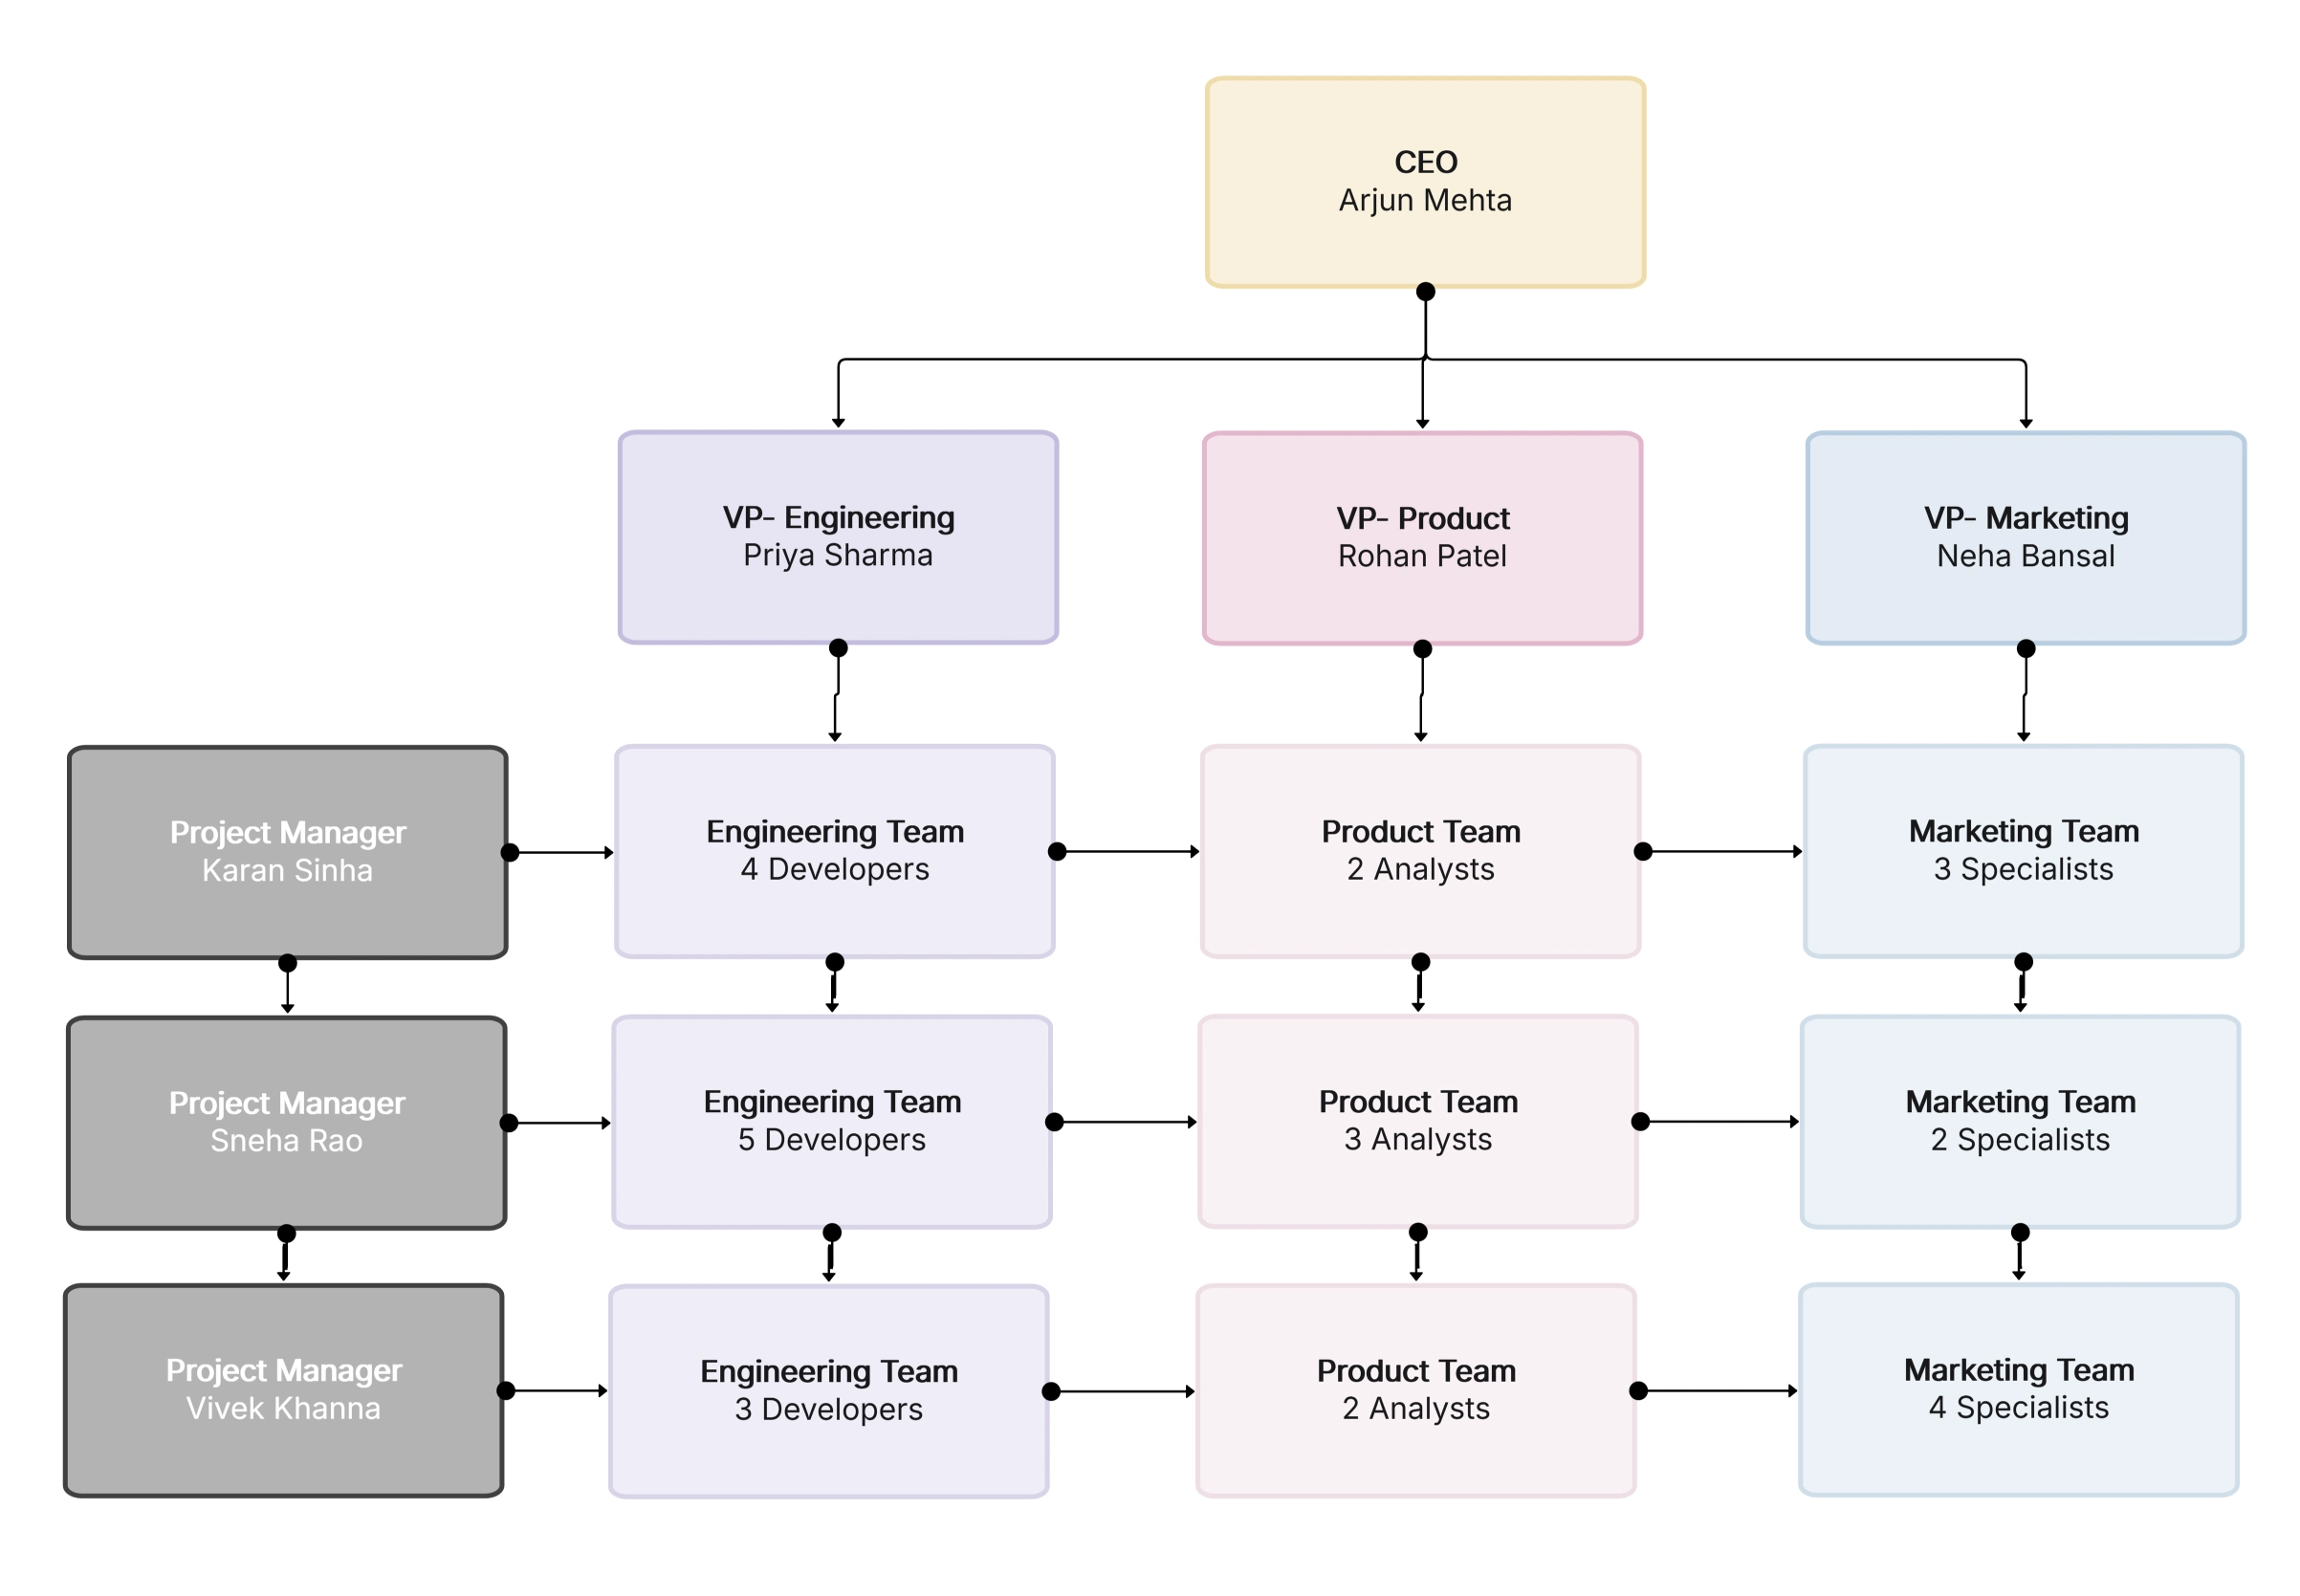
Designing an IT organizational chart starts with strategy: outcomes, risk posture, and scale. Then map responsibilities, owners, and interfaces with Finance, HR, and Legal. Your chart should show lines for decision rights, not just boxes. Use the Industry Org Chart Maker and detailed IT Template to accelerate setup and collaboration.

Here are the steps to create your IT organizational chart.

  • Define Strategy, Scope, and Guardrails: Capture business goals, regulatory context, and service tiers. Decide what must be standardized—identity, observability, data privacy—and where teams can choose tools. This balance keeps innovation moving while safeguarding security, cost, and supportability across environments and vendors.
  • Map Capabilities and Ownership: List capabilities—engineering, QA, SRE, security, data, support—and assign accountable leaders. Draw dependencies and escalation paths. This reveals coverage gaps and clarifies who approves changes, budgets, and exceptions when timelines compress or incidents emerge unexpectedly.
  • Design the Structure and Cadences: Choose centralized, decentralized, or matrix. Add committees (architecture, change), rituals (QBRs), and OKRs. Publish a RACI for cross-team work. These rhythms transform the chart from static art into an operating system that sustains delivery momentum.
  • Implement, Share, and Iterate: Build in the Industry Org Chart Maker, brand it, and share. Review quarterly with executives. Capture lessons from incidents and audits, then adjust roles or lines to improve resilience, security, and developer experience over time.a

Governance, Risk, and Compliance in IT Org Charts

An IT organizational chart should make risk ownership unmistakable: who approves access, monitors threats, patches systems, and signs off on change windows. Clear lines reduce audit friction and shorten incident cycles. The chart must reflect policies for identity, encryption, backup, data retention, and vendor oversight. For cross-industry expectations, reference the Report: Industry Organizational Chart Trends and adapt your model accordingly.

See below for governance best practices to embed in your structure.

  • Single-Threaded Security Ownership: Place a CISO or security leader with authority across cloud, endpoints, and data. Publish policies, run tabletop exercises, and track closure of audit findings. Consolidated ownership prevents gaps during incidents and ensures controls stay effective as the stack evolves.
  • Architectural Guardrails & Reviews: Establish an architecture council and golden paths. Require design reviews for major changes, focusing on reliability, cost, privacy, and portability. Guardrails enable speed without chaos by guiding teams toward secure, supportable solutions repeatedly.
  • Change, Release, and Incident Practices: Define CAB participation, release calendars, and on-call rotations. Clarify severity levels and comms templates. Document who declares incidents and who communicates externally, minimizing confusion and reputational risk when minutes matter.
  • Third-Party & SaaS Oversight: Assign owners for vendor risk, data processing agreements, and exit plans. Catalog integrations and privileges. This visibility reduces surprise exposure and keeps your ecosystem resilient if a supplier degrades or sunsets services unexpectedly.

Metrics and Continuous Improvement for IT Structures

An IT org structure improves only when measured. Leaders need KPIs that show flow efficiency, service health, and security posture. Your chart should align to these metrics so accountability is visible. Tie incentives to reliability and value, not just output. Explore performance alignment in the Guide: Industry Organizational Charts and evolve with insights from the Ebook.

See below for metrics to operationalize in your IT organizational chart.

  • Flow & Delivery: Track lead time, deployment frequency, change failure rate, and MTTR. Visualize which leaders own improvements, so coaching and investments follow the data. Consistent visibility transforms firefighting into systemic optimization across teams and services.
  • Reliability & Cost: Monitor SLOs, error budgets, capacity, and cloud spend. Owners should review trade-offs monthly, balancing performance with efficiency. Publishing these metrics reduces finger-pointing and supports pragmatic, data-driven prioritization with finance and product peers.
  • Security & Compliance: Measure patch cadence, vulnerability backlog, incident dwell time, and control coverage. Assign accountable leaders per domain. Regular reporting builds stakeholder trust and simplifies audits because ownership and progress are always visible.
  • People & Capability: Track skill coverage, hiring velocity, attrition, and internal mobility. Capability maps inside your chart reveal where to upskill, automate, or hire keeping critical systems supported and teams motivated long term.

Conclusion

A well-designed IT organizational chart is your operating system for delivery, reliability, and security. By clarifying ownership and cadences, you accelerate outcomes and reduce risk—without sacrificing innovation. Start with a model that matches your strategy, then iterate using metrics and governance. Build collaboratively inside Cloudairy to keep structures living and accurate.

Create yours now with the Industry Org Chart Maker and customize the IT Organizational Chart Template for immediate clarity.

IT Organizational Chart Template

FAQs

1. What is an IT organizational chart and why is it important?

The IT organizational chart makes the different roles, reporting lines, and responsibilities in the technology teams visible. It is significant since it removes confusion, quickens decision-making, and makes it clear who is responsible for reliability, security, and delivery. Unambiguous charts further facilitate audits, budgets, and recruitment by linking strategy to responsible leaders.

2. Which IT organizational structure should we choose?

The most suitable IT organizational structure is determined by factors such as risk, size, and speed needs. Centralized structures reach the highest possible level of uniformity; decentralized structures reach the highest possible level of flexibility; and matrix combines both. Test the model in one area, track the results, and roll it out to other areas. Weigh alternatives using the IT Template and Report.

3. What roles must appear in an IT org chart?

Every IT department hierarchy should show CIO/CTO, architecture, engineering, infrastructure/SRE, data/analytics, security/GRC, and IT operations/support. These roles anchor strategy, delivery, and resilience. Use the Company Template to align with broader business structures cleanly.

4. How do we keep our IT org chart up to date?

Maintain your information technology organizational chart in a collaborative tool. Review quarterly with leaders, update after reorgs, and link charts to onboarding, incident playbooks, and audits. The Industry Org Chart Maker enables real-time edits and secure sharing across stakeholders.

5. Can this help with security and compliance?

Yes an explicit IT organizational chart shows who owns controls, incidents, changes, and vendor risk. When auditors ask “who approves what,” the answer is visible. Pair the chart with RACI and metrics, and reference the Guide for governance best practices and templates.

Ready to create smarter with AI?

Start using Cloudairy to design diagrams, documents, and workflows instantly. Harness AI to brainstorm, plan, and build—all in one platform.

Recommended for you