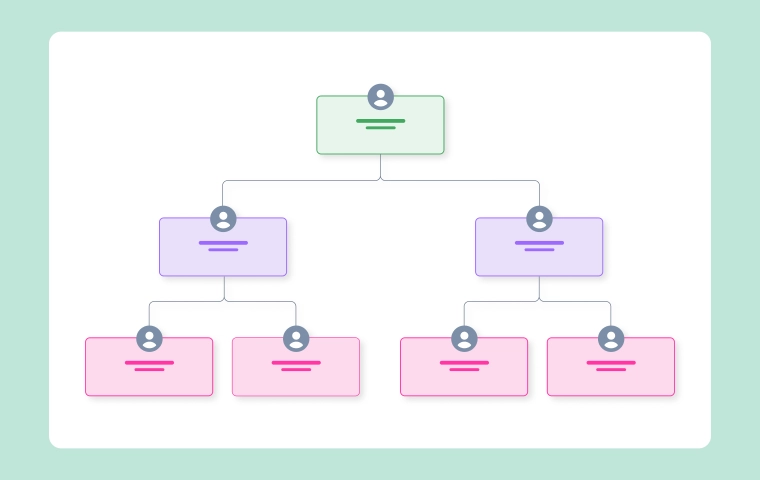
Org Chart
How to Create a Graphic Organizer Easily: A Step-by-Step Guide
.webp)

AI Workspace for Diagrams & Collaboration
Get your team started in minutes
Sign up with your work email for seamless collaboration.
Getting info organized is crucial for learning, planning, and fixing problems. Whether you're studying for exams, teaching a class, or working on a project, clear presentation makes everything click better. Graphic organizers are killer tools for this. They turn complicated ideas into visuals that are simple to grasp, remember, and explain.
This guide shows you how to make a graphic organizer step by step. Simple tricks that work for school, jobs, or personal use.
It's a picture-based way to show info and connections between ideas. Shapes, lines, labels, and symbols make it all logical. Skip the wall of text you see key points and links instantly.
Common uses: studying, brainstorming, writing, planning, decision-making. They organize random thoughts into sharp visuals.
Get why they're great before diving in. They help you:
No wonder they're popular in schools, offices, and creative work.
Start by figuring out your goal. What do you want this thing to do? Compare stuff? Show a process? Brainstorm? Organize data?
Clear purpose picks the right setup and content. Comparing needs different layout than steps. Keeps everything on track.
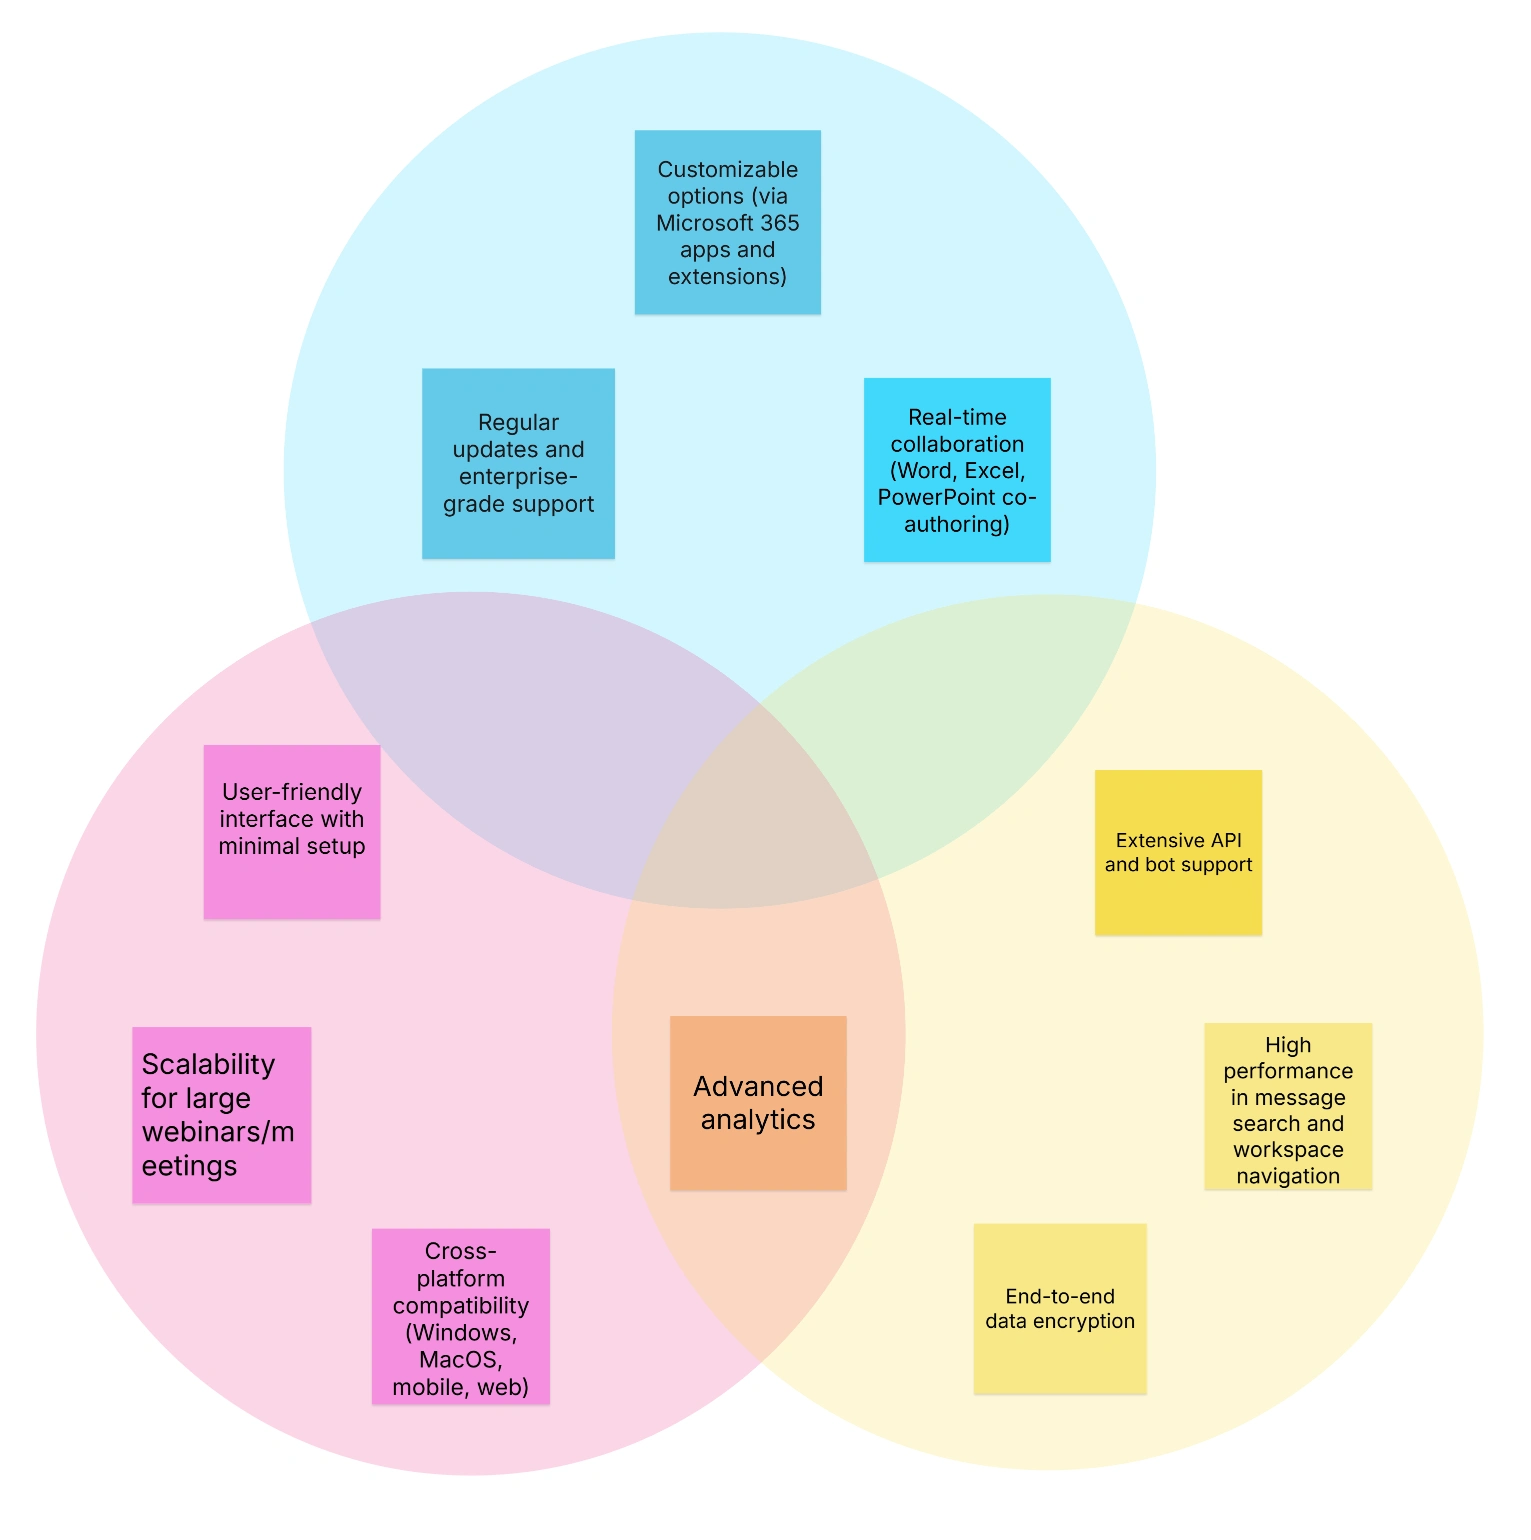
Goal in mind? Pick the perfect format. Each type fits specific needs.
Right choice = easier to read + better looking.
Grab the essential stuff. Main ideas, core details, supporting points. Ditch anything extra that clutters.
Quick list first, then slot into the visual. Keep it clean and complete.
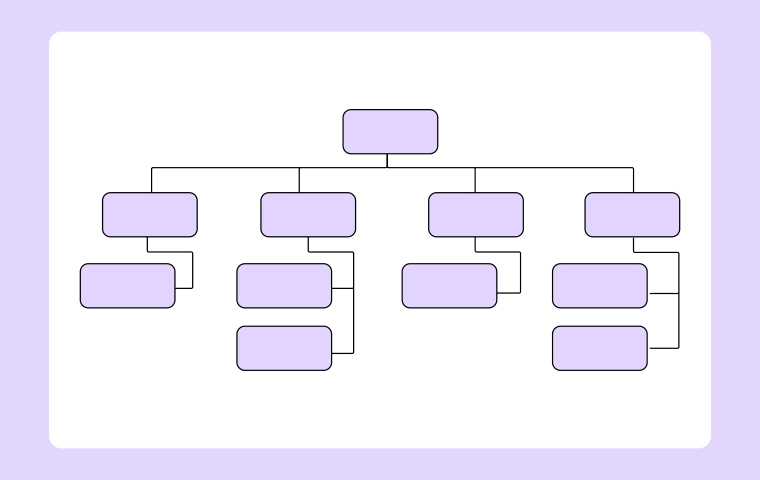
Place info so it flows naturally. Show the connections clearly.
Flowcharts: start-to-finish sequence. Mind maps: branches from center. Tables: consistent categories.
Labels are everything. Short, meaningful words for every part. No long sentences.
Headings guide viewers and explain sections. Smart labels = less confusion, more clarity.
Clean and readable wins. Don't overload with text, shapes, or bling.
Space out ideas. Match shapes, align neatly. Simple lets content stand out.
Check your work. Accurate? Complete? Organized? Would others get it easily?
Cut extras, simplify labels, tweak layout. Polish makes it pro.
Put it to work as planned. Study tool, planner, teaching aid, reference.
Reuse with tweaks for other topics. One structure, many uses.
Nail them every time with these:
These boost results big time.
Steer clear of: info overload, vague labels, wrong format, poor balance.
Avoid these = clean, clear, effective organizers.
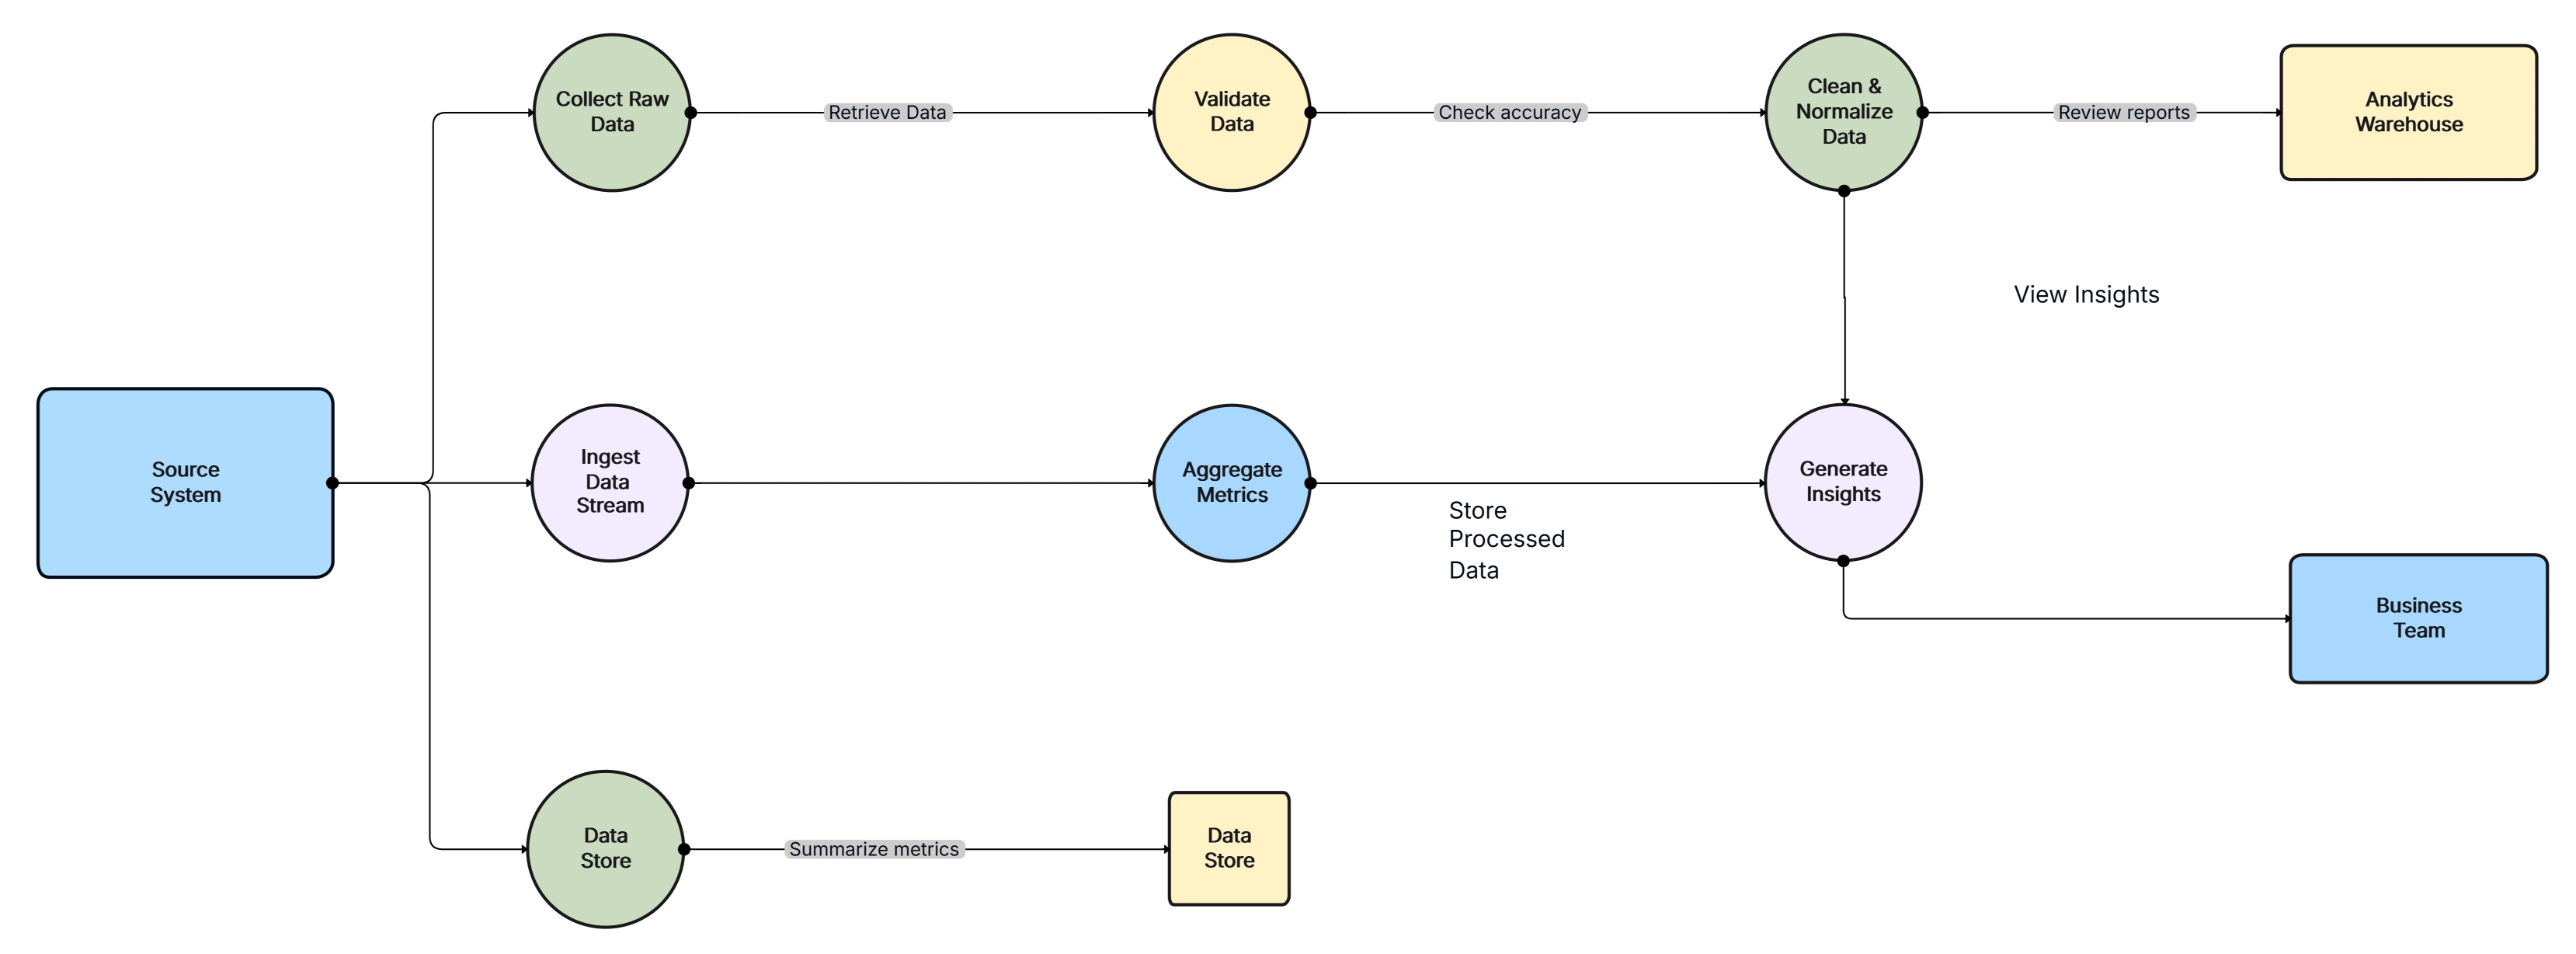
No design skills needed. Follow the steps set purpose, pick format, organize smart, stay simple and you can create great visuals easily. Using a Data Flow Diagram, you can transform complex or messy information into clear, structured visuals that are easy to understand.
They transform messy info into clear visuals for better learning, planning, and communication. Perfect for school, work, and personal projects powerful for organizing thoughts and understanding.
1. What is a graphic organizer?
2. Why are graphic organizers useful?
3. Which graphic organizer should I choose?
4. Can beginners create graphic organizers easily?
5. Where can graphic organizers be used?
6. Do graphic organizers work for all age groups?
Start using Cloudairy to design diagrams, documents, and workflows instantly. Harness AI to brainstorm, plan, and build—all in one platform.
Table of Contents

Introduction
 Manage all your work in one placeCollaborate with your teamUse Cloudairy for FREE—forever


 Related Articles

.webp)