Org Chart
Graphic Organizer Examples for Students, Teachers, and Professionals

AI Workspace for Diagrams & Collaboration
Get your team started in minutes
Sign up with your work email for seamless collaboration.
Graphic organizers offer a practical and fun solution by giving all that information visually in a structured and meaningful way that everyone can see easily. They help people to clarify their thoughts super clear, identify relationships between different parts, and communicate ideas more efficiently without any mix-ups.
This article explores practical graphic organizer examples for students who learn in class, teachers who guide lessons, and professionals who do big jobs, showing how these visual tools support learning new things, planning steps ahead, and decision-making across different environments like school, home, or office spots.
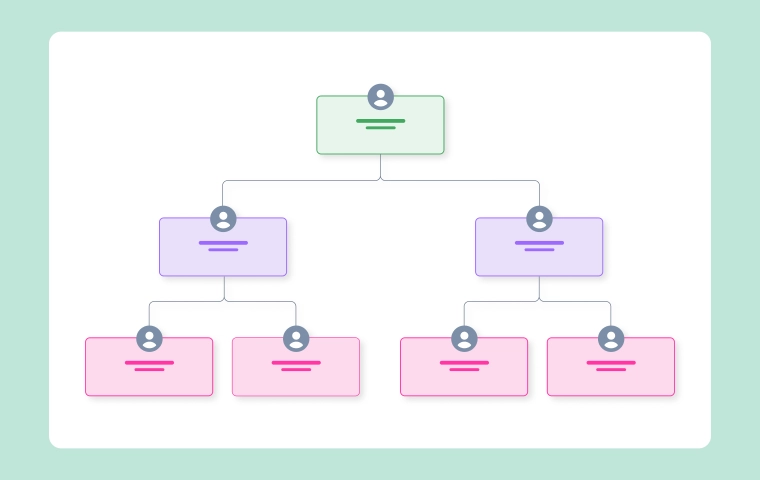
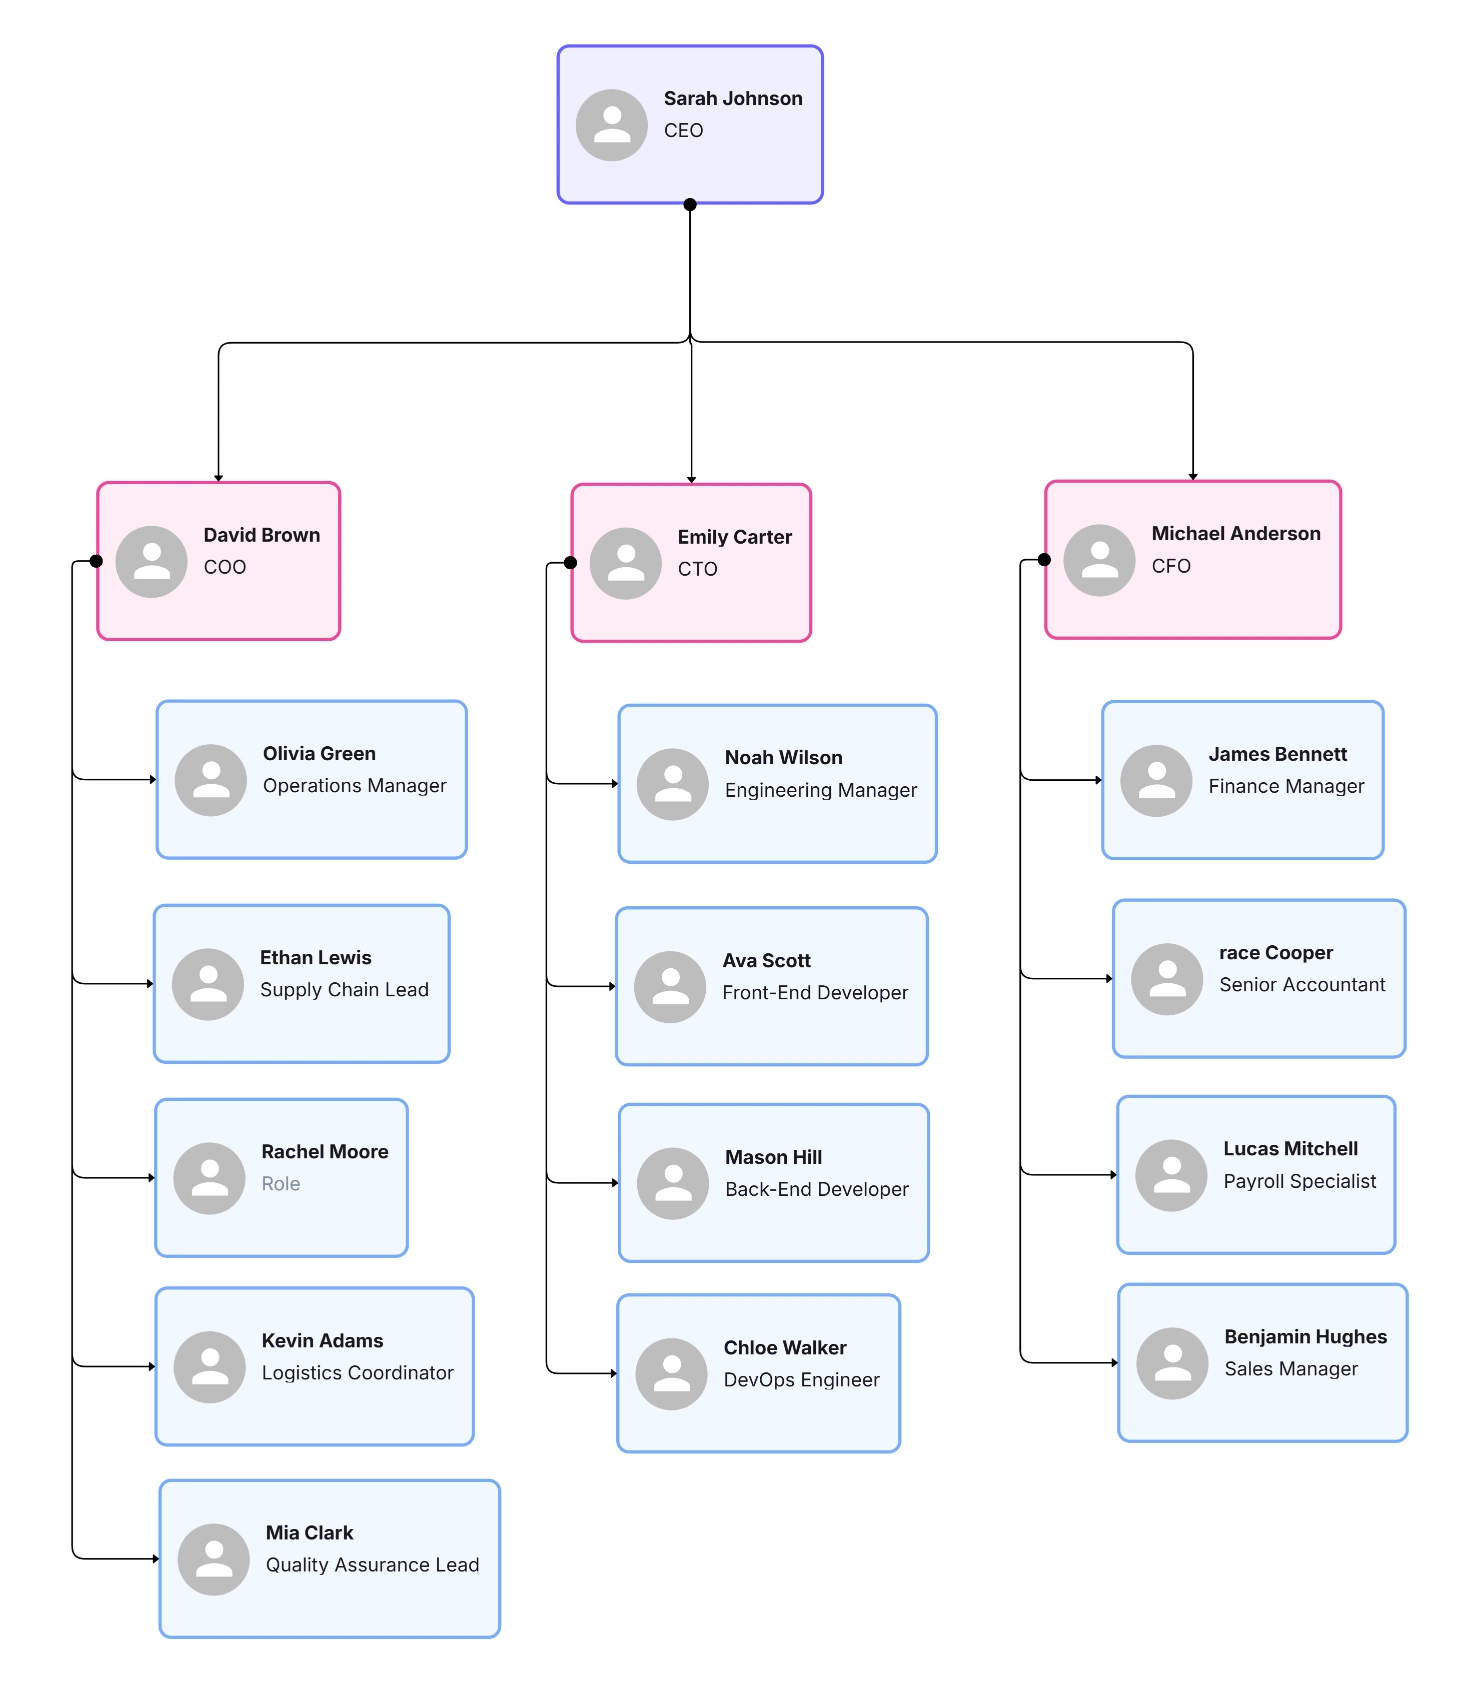
Graphic organizers, including Organizational Charts, are picture tools used to sort info in a simple and smart way. They use shapes, lines, and name tags to show how ideas or big thoughts connect. By changing info into picture forms, such as flowcharts and organizational charts, graphic organizers make hard stuff quick to understand, easy to remember, and simple to use in play or work.
They are widely used in classrooms, workplaces, and creative tasks because they improve clarity and encourage structured thinking.
Students frequently handle large amounts of information across several subjects. Graphic organizers help them compile content, enhance comprehension, and study more effectively.
Mind maps are one of the most popular graphic organizers for students. They make a central topic in the central and branch related ideas outward. This configuration helps students investigate topics freely while maintaining structure.
Mind maps are useful for brainstorming ideas, planning essays, summarizing chapters, and revising for exams. They support visionary thinking and help students see how ideas are connected.
Venn Diagrams for Comparison
Venn diagrams are great for showing how two or more things are the same and different. Kids use them a lot in school subjects like stories, history, and science to spot what matches and what does not.
For example, you can use a Venn diagram to compare story characters, big events from long ago, or ideas about how science works. This fun picture way helps you think better and really get what things mean.
Flowcharts for Understanding Processes
Flowcharts help kids learn steps and how things go in order. They work best in school topics with steps or thinking in a line, like math, science tests, or computer fun.
By visually mapping each step, flowcharts make complex processes easier to follow and remember.
Concept Maps for Topic Understanding
Concept maps show how ideas connect with lines and words. Kids use them to sort big topics, see what makes what happen, and join new facts to what they know.
This type of organizer supports deep learning and critical thinking.
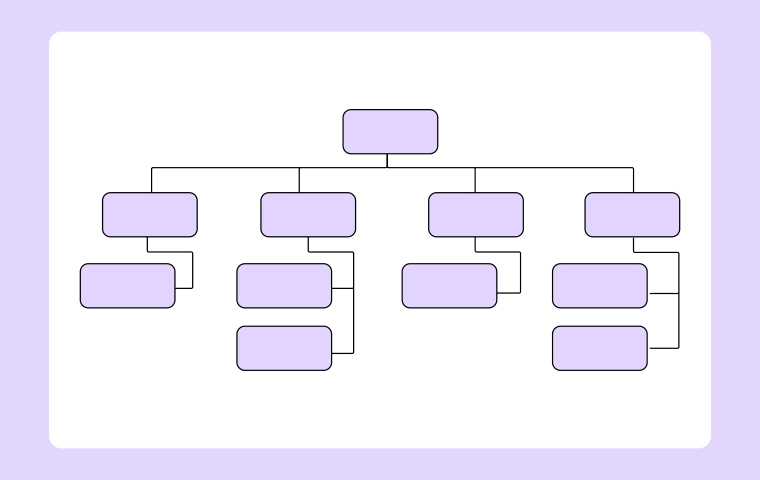
Teachers use graphic organizers to design lessons, explain concepts clearly, and assess student understanding. These tools also help educators plan and organize their teaching strategies using visuals like a Simple Organizational Chart Template, which shows the flow of ideas and steps in a structured way.
Lesson planning charts help teachers plan goals, fun activities, and checks on learning. By putting lesson parts in pictures, teachers make class go smooth and kids learn clear things.
These organizers also save time and improve lesson consistency.
KWL Charts for Active Learning
KWL charts help kids in class see what they learn. They have three parts: what kids know now, what they want to know, and what they learned after.
This organizer encourages student engagement and helps teachers measure learning progress effectively.
Timelines for Historical and Sequential Topics
Timelines help teachers show events in time order. They work great in history, stories, and people studies.
By drawing the order of what happens, timelines make it easy to get and see what causes what over days or years.
Rubric and Assessment Tables
Teachers use tables and charts to make score guides and tests. These helpers show clear rules for grades, how good work looks, and what kids need to do.
Such visual clarity supports fair evaluation and transparent communication with students.
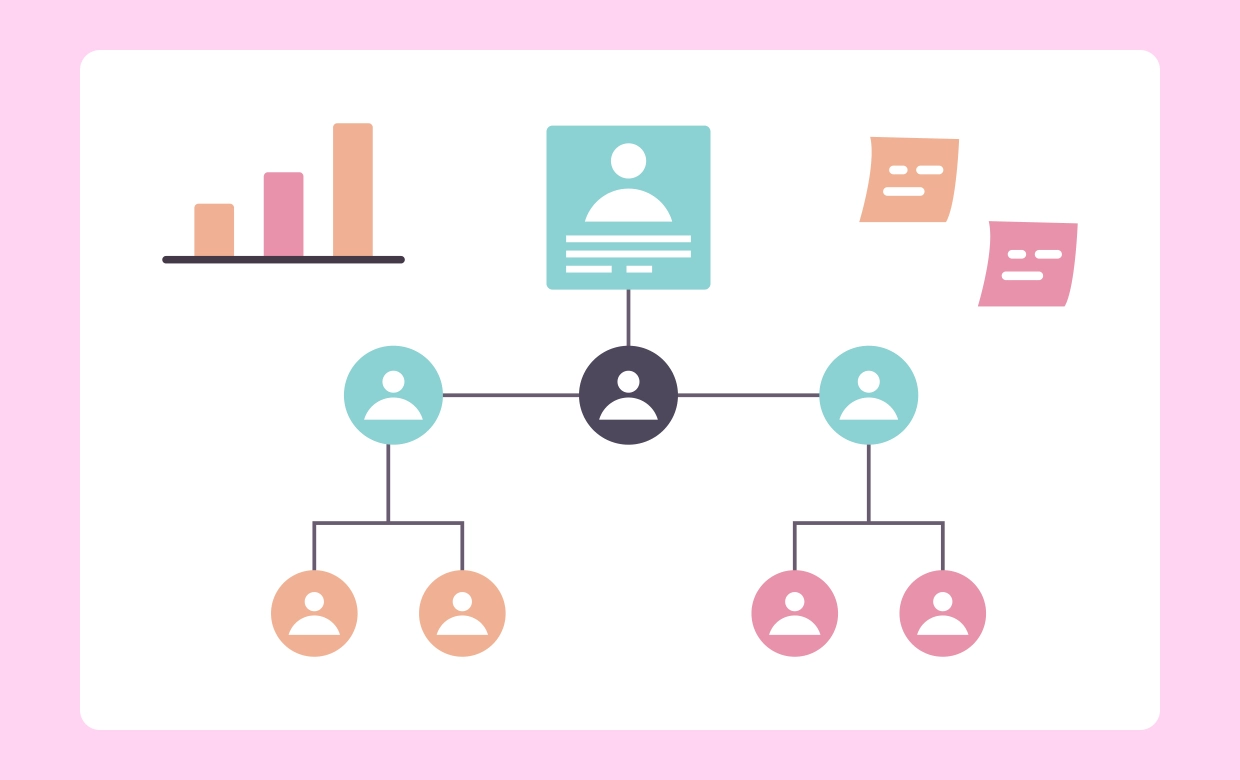
In work places, picture organizers help plan, think deep, and talk clear. They let teams sort ideas, run jobs, and pick smart choices.
Flowcharts for Process Mapping
Flowchart get used a lot at work to draw work steps and ways to do things. They help grown-ups see how jobs go from one part to next and spot slow spots.
Process flowcharts are valuable in operations, quality control, and system design.
Decision Trees for Problem-Solving
Decision trees show picks and what might happen next in pictures. Grown-ups at work use them to check choices, see dangers, and pick smart paths.
This organizer is particularly useful in management, finance, and strategic planning.
SWOT Analysis Charts
SWOT Analysis charts sort good points, bad points, opportunity areas, and threat areas into easy-to-understand visuals. People use SWOT Analysis a lot for work plans, evaluating strategies, and checking rivals.
This organizer helps professionals gain a balanced view of internal and external factors affecting decisions.
.webp)
Project Planning Boards
Project planning boards sort jobs, time lines, and who does what. They help teams watch how things go and keep all clear from start to end.
Visual project organizers improve collaboration and accountability.
Graphic organizers provide several benefits regardless of the user’s role:
These benefits make graphic organizers versatile tools across education and professional environments.
Picking the best picture helper fits the job and what you want. Jobs to match things need other shapes than steps to tell or idea fun times.
Understanding the purpose helps users choose the most effective organizer and achieve better results.
Graphic organizers are strong helpers for learning, teaching, and work jobs. From brain maps and overlap circles kids use to class plan charts for teachers and step flow pictures for grown-ups, these tools make hard stuff clear and neat.
By picking the right picture helper for each job, people think better, plan smart, and share ideas with happy hearts.
.Start using Cloudairy to design diagrams, documents, and workflows instantly. Harness AI to brainstorm, plan, and build—all in one platform.
Table of Contents

Introduction
 Manage all your work in one placeCollaborate with your teamUse Cloudairy for FREE—forever


 Related Articles

.webp)