Graphic Organizer Templates & Maker

AI Workspace for Diagrams & Collaboration
Get your team started in minutes
Sign up with your work email for seamless collaboration.
Graphic organizers are fun visual tools. They help you put your ideas in a nice spot. They take big or tricky info and split it into small, easy bits. This way, anyone can get it fast.
Teachers use them to make lessons super clear. Kids use them for tidy notes. Teams at work use them to plan jobs, get tasks, and sort ideas without mix-ups.
Cloudairy makes these organizers easy and quick. The site is simple, looks fresh, and helps you build neat drawings in minutes.
You drag shapes, pick colors, add words, and fix spots with no hard work. Newbies get help from smart guides.
Cloudairy lets friends work together right away. Your team, school pals, or group can add thoughts to one drawing. This makes planning and getting ideas smooth and fun.
A graphic organizer is a fun visual chart. It helps you sort ideas in a clear way. It makes info easy to see, get, and keep in mind.
Many types exist like flow charts, mind maps, Venn circles, time lines, story maps, and charts. They all do one big job: turn hard ideas simple.
Graphic organizers let you match info, spot links, see what causes what, and split big topics into tiny bits. This boosts thinking, learning, and planning.
Teachers, kids, work teams, and thinkers use them for classes, notes, job flows, data checks
Graphic organizers are super useful. They help people get information by showing it in a clear, fun visual way. This makes learning and work way simpler and not so confusing.
Pictures and diagrams help us remember stuff better. They make hard topics easy to get, whether you are in school, college, or at your office job.
Graphic organizers show how ideas connect to each other. They let you spot patterns, see what is missing, and understand links that are tough to see in long writing.
They also help you compare ideas, follow steps in order, see what causes what, and group info the right way. This makes it easier for everyone to work together.
Cloudairy makes this even better with simple digital tools. You can make, change, and share graphic organizers online. They are great for learning, team work, planning, and research.
Graphic organizers give lots of benefits for learning, work, planning, and strategy. They change info into clear, visual charts that help people understand things faster and better.
When you see info in a visual way, it is easier to remember and think about. That is why graphic organizers are so useful for students and teams with hard topics or big piles of info.
They also make talking better by giving everyone a simple, organized way to share ideas. This makes chats easier and helps folks explain thoughts more clearly.
Graphic organizers help with better choices too. They show links, empty spots, and patterns that you miss in long writing. They also help with fast checks and fun brainstorming.
Cloudairy makes all these good things even stronger. With ready templates, live team work, easy drag-and-drop tools, and simple downloads, every graphic organizer turns neat, clear, and ready for class or work.
A graphic organizer creator is a digital tool that helps users design visual diagrams to organize ideas, information, and processes in a clear and structured way. Instead of drawing organizers manually, users can quickly build mind maps, flowcharts, Venn diagrams, timelines, organizational charts, and other visual layouts using ready-made shapes, connectors, and templates.
These tools are especially helpful for students, teachers, and professionals who need to simplify complex topics, plan projects, compare concepts, or present information visually. Most graphic organizer creators offer drag-and-drop functionality, customizable styles, collaboration features, and export options, making it easy to create polished diagrams for classroom activities, business planning, or personal productivity.
Using a graphic organizer creator saves time, improves clarity, and supports better decision-making by turning large amounts of text or ideas into easy-to-understand visuals. Whether brainstorming new concepts, mapping workflows, or structuring lessons, these tools make visual thinking more accessible and effective for everyday tasks.
Understanding the difference between traditional hand-drawn organizers and modern digital tools can help you choose the right approach.
| Feature | Manual Organizers | Cloudairy Digital Organizers |
|---|---|---|
| Creation Speed | Slow and time-consuming | Fast drag-and-drop editing |
| Editing | Requires redrawing | Easy real-time updates |
| Collaboration | Limited to physical sharing | Live team collaboration |
| Design Quality | Depends on drawing skill | Clean professional layouts |
| Storage | Paper-based and hard to manage | Cloud storage and version history |
| Export Options | Not available | PDF, PNG, JPG, SVG downloads |
These graphic organizers help sum up, compare, sort, and map info in a picture way.
Concept maps are fun charts that show how different ideas link up. They help people get a topic by seeing all the related ideas in one spot.
A concept map starts with one big main idea right in the middle. Then lines and branches spread out to show related ideas, and tiny branches add more details or fun examples.
This easy setup makes concept maps awesome for brainstorming, planning research, making lessons, mapping systems, and sorting thoughts super clearly.
Cloudairy makes concept maps really easy to make. You can drag and drop shapes, pick colors, add words, and use ready template to build your picture fast.
Teams and classrooms can work on them together at the same time, too. This makes concept maps great for group fun, teaching, and showing hard topics in a simple picture way.
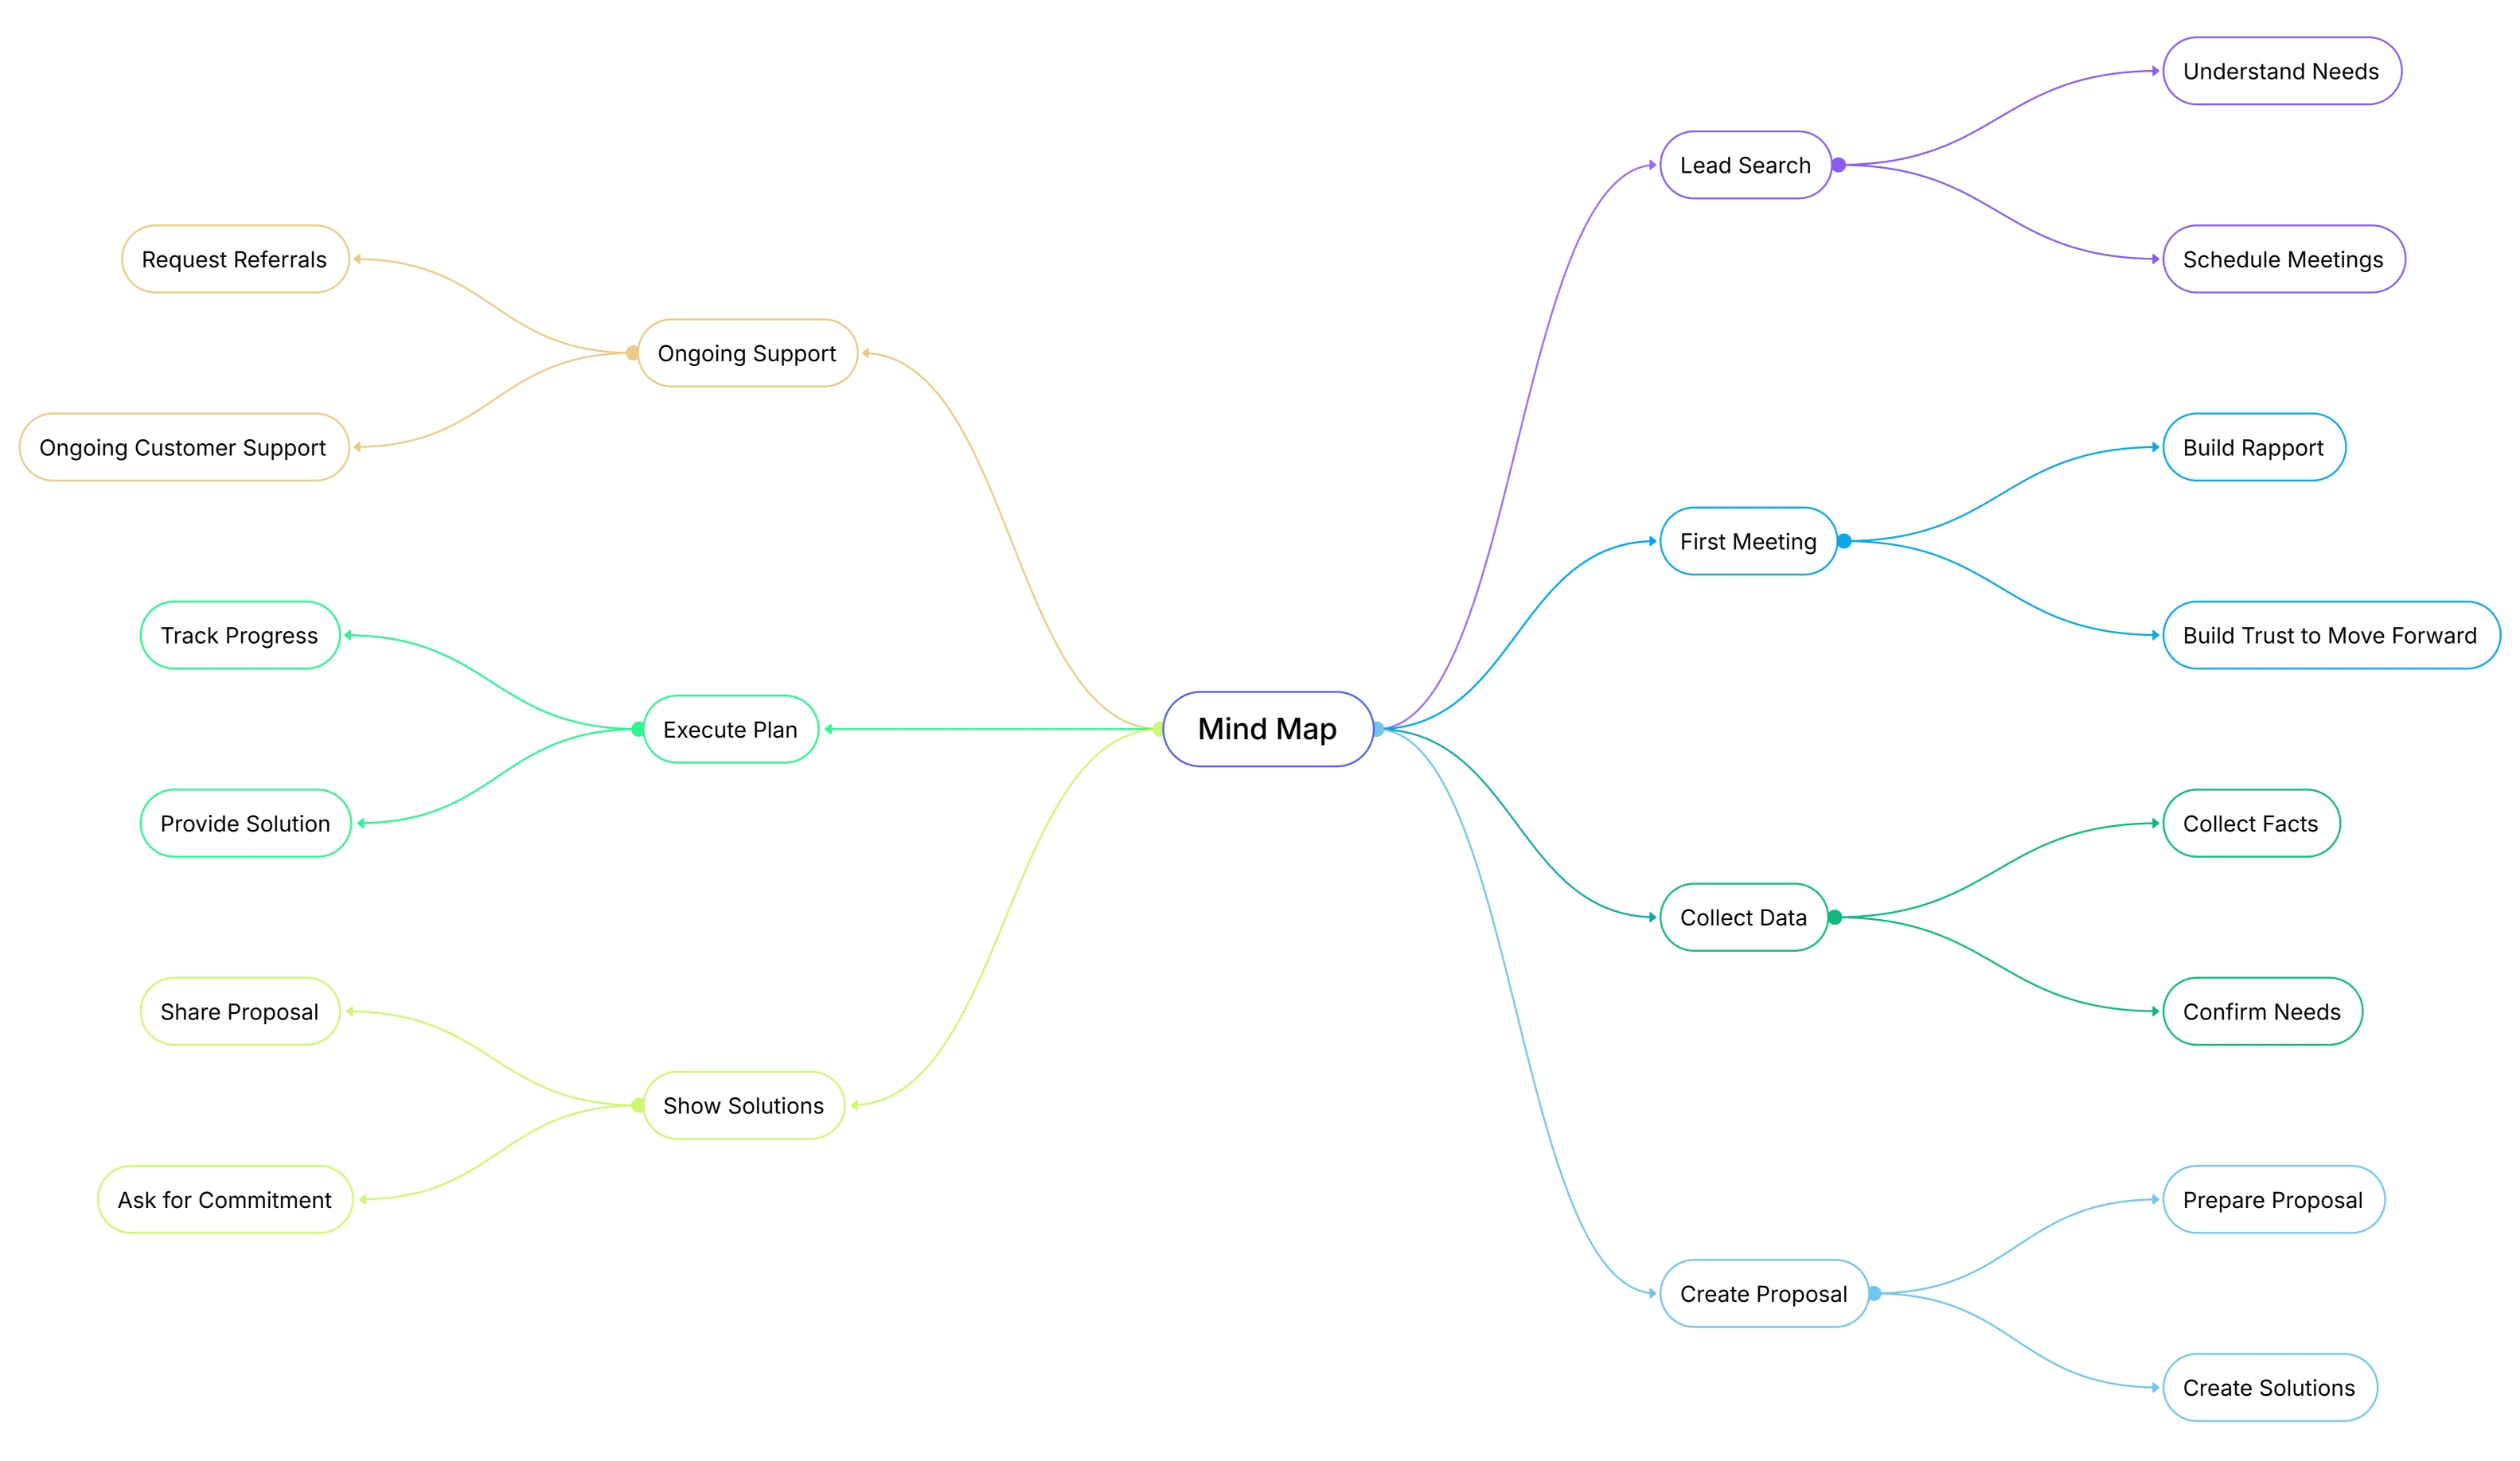
Mind maps are simple picture charts that help with creative thinking and brainstorming. They grow from one main idea and show all the related ideas in a clear, connected way.
A mind map starts with one central idea right in the middle. From there, branches go outward to show themes, topics, or related points, and these branches can keep growing as needed.
People use mind maps for planning talks, writing essays, sorting product features, making marketing ideas, summing up books, and getting user personas in a clean picture format.
Cloudairy makes mind maps super easy to create. You can drag and drop shapes, pick colors, add many levels, and use color sections to sort ideas fast.
With fun icons, shapes, lines, and ready templates, Cloudairy helps people and teams think free, find new ideas, and link thoughts the right way making mind maps perfect for creativity and smart planning.
Flowcharts and process maps are simple picture guide that show a process step by step. People use them in business, UX, engineering, and project jobs to see how things go from start to finish.
These pictures use easy shapes boxes for actions, diamonds for yes-or-no choices, circles for start or end spots, and arrows to show the way. This makes the whole process super clear.
Cloudairy makes flowcharts really easy to create. You can drag and drop shapes, and the tool keeps everything neat and lined up right as you change or add steps.
Flowcharts help teams get tough tasks, spot problems, and save key processes like SOPs, customer paths, system flows, and new hire steps.
Cloudairy also gives fun flowchart styles like straight-line ones, branching ones, swimlane ones, and team-cross ones so you pick what fits your job best.
.webp)
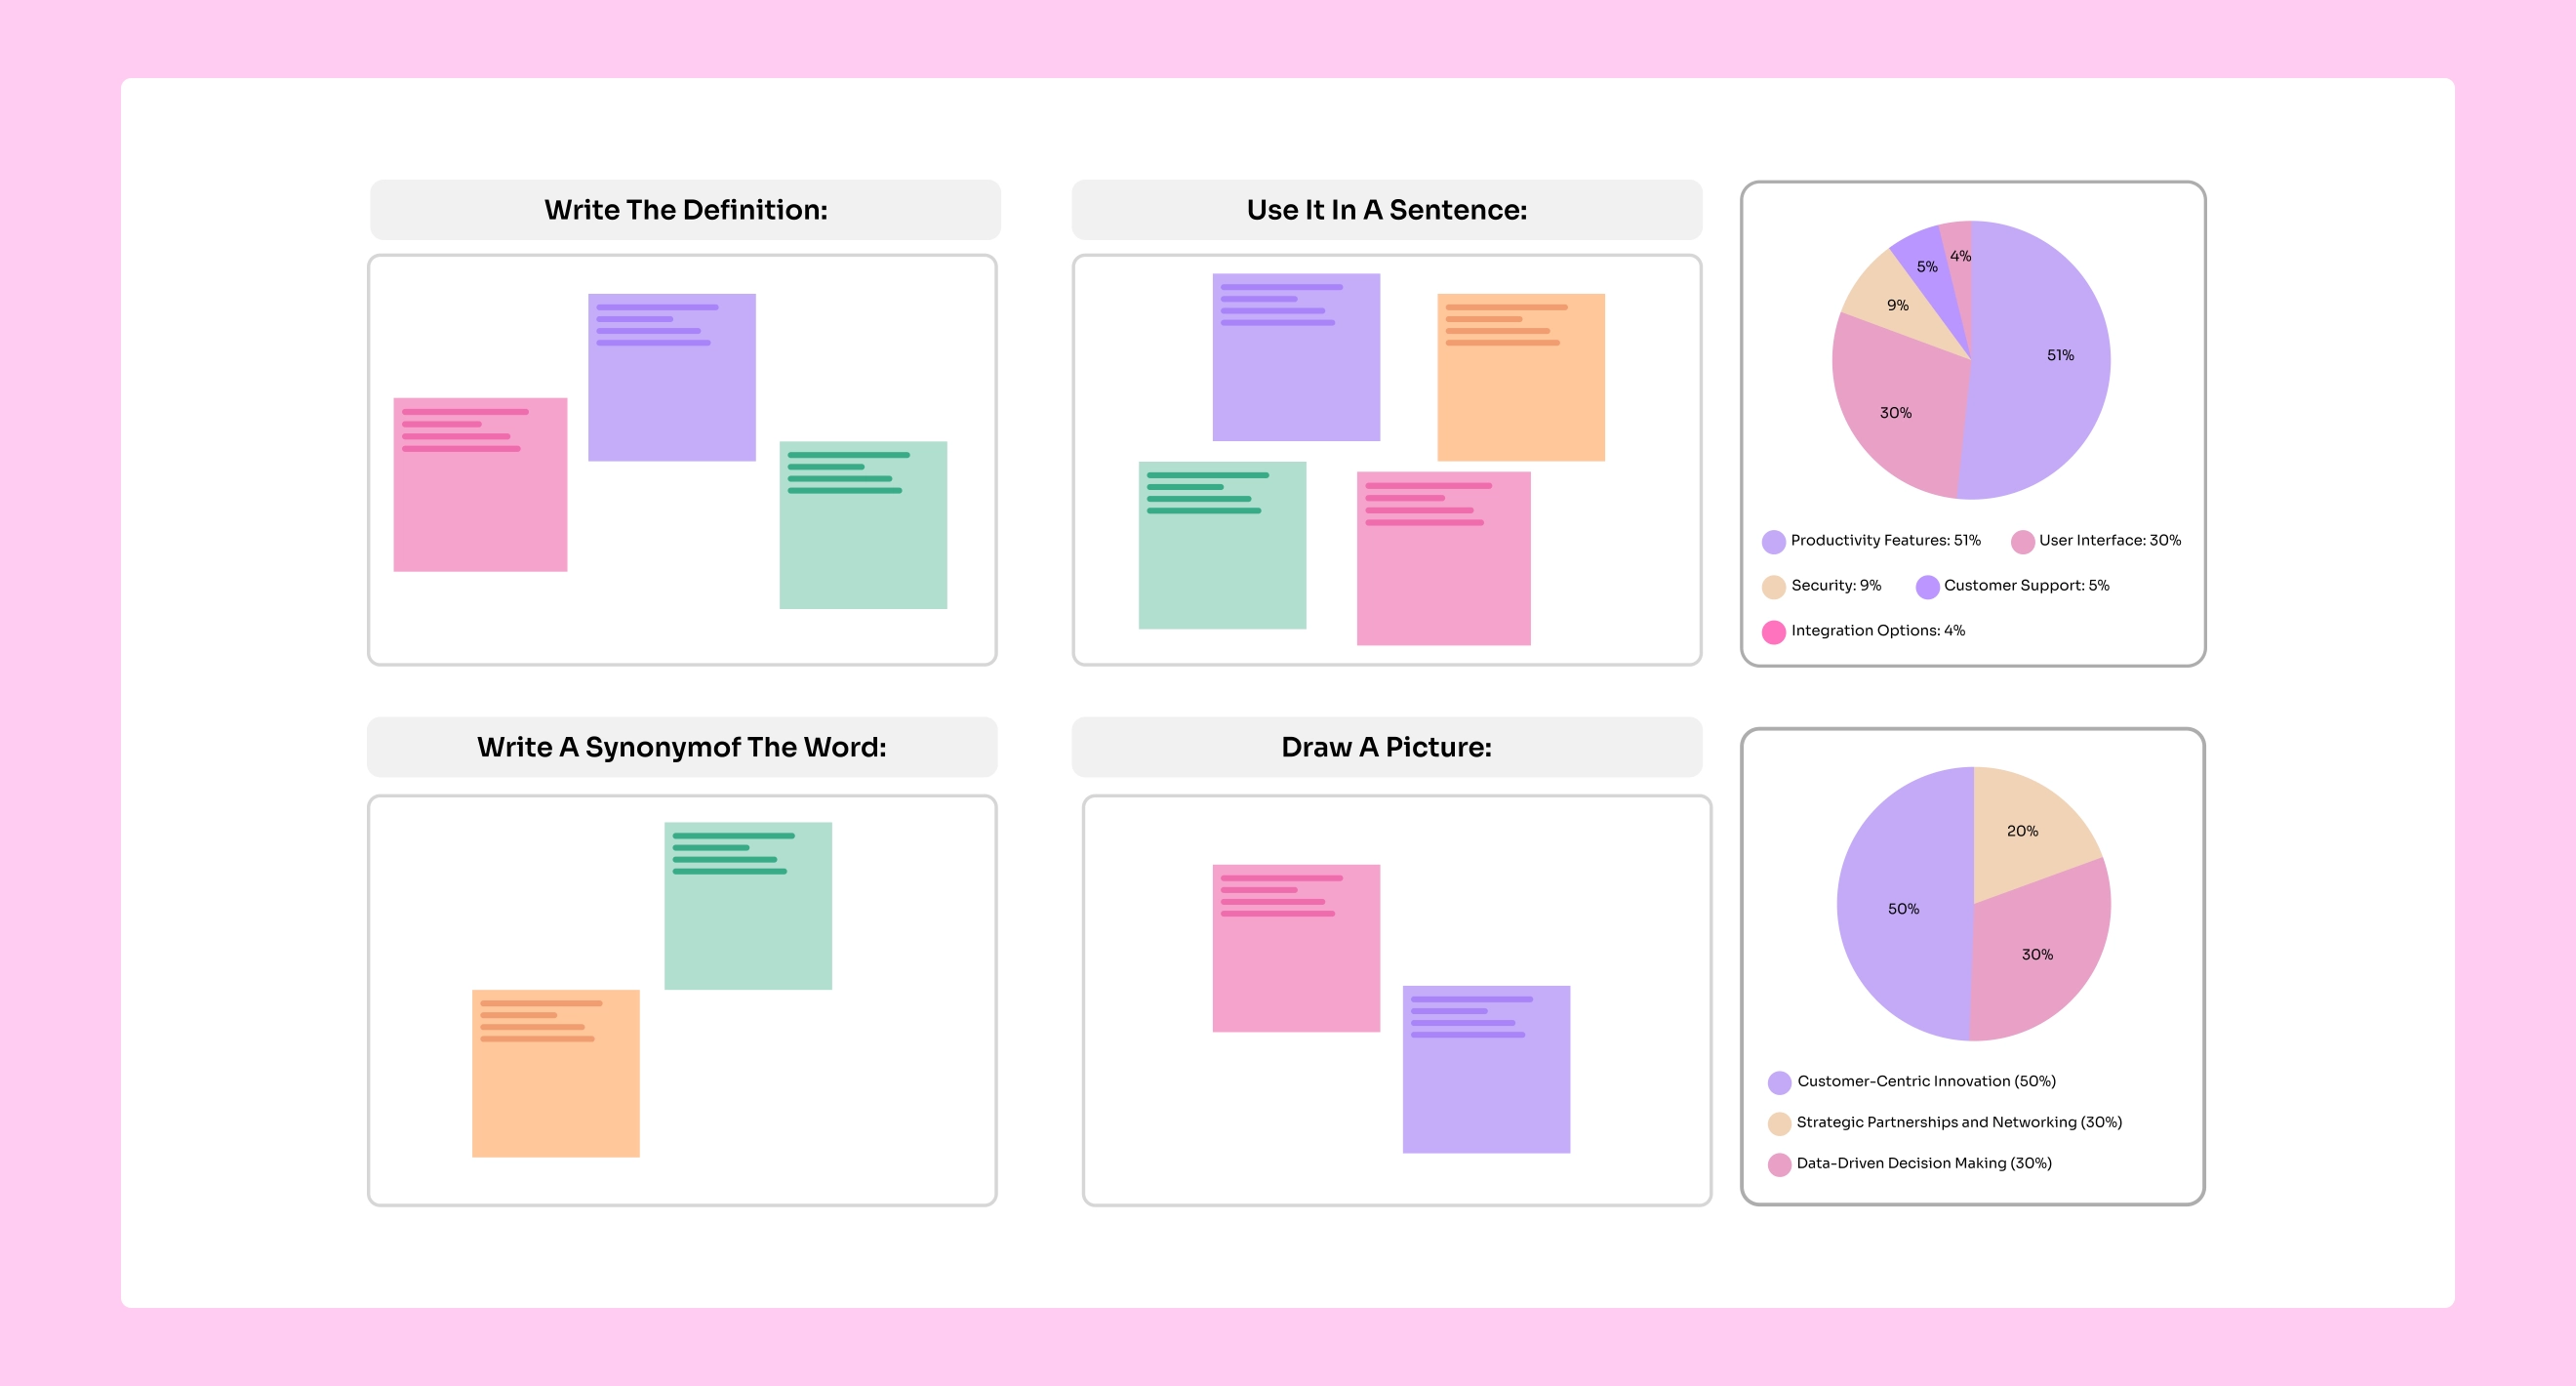
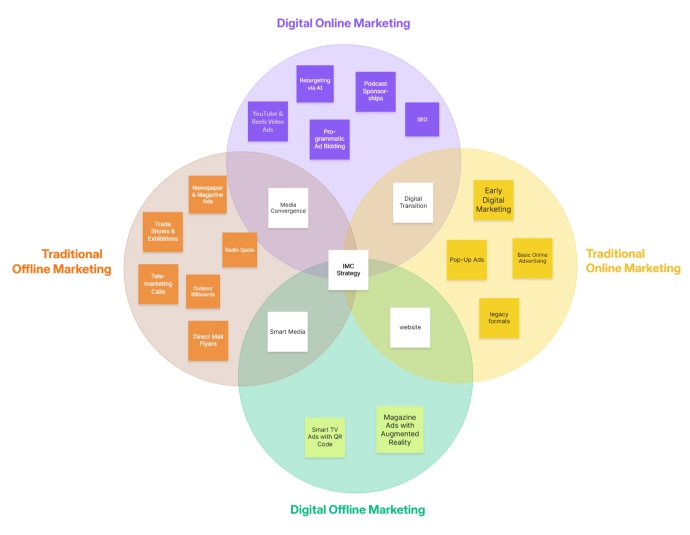
Venn diagram, comparison charts, and T-charts are simple tools that help you compare things super easy. They show what is the same, what is different, and what choices you got.
A Venn diagram uses circles that overlap to show shared stuff right in the middle and special stuff out on the sides. Comparison tables use rows and columns to check features nice and clear.
Cloudairy makes it really easy to create Venn diagrams. You can pick colors, add words, change circle sizes, and make two-circle, three-circle, or bigger ones in just minutes.
You can also whip up comparison charts fast with Cloudairy’s simple grid tools. This helps folks compare choices and pick better ones without getting mixed up.
These tools shine in schools and offices because they make comparing ideas simple, clear, and quick for everybody.
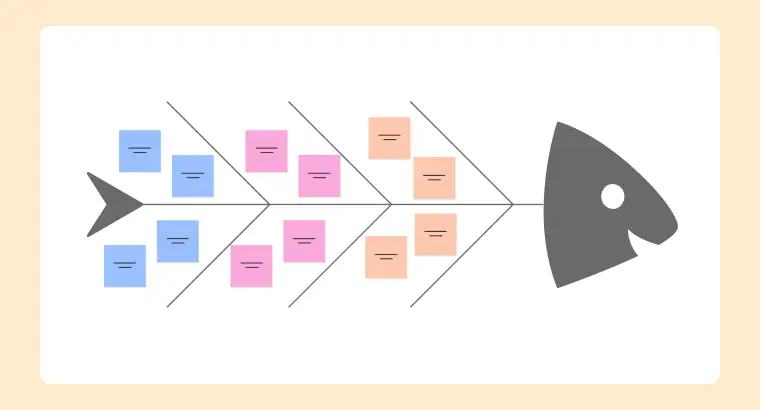
Cause-and-Effect Organizers
Cause-and-effect graphic organizers are key for quality checks, operations, team look-backs, and big-picture thinking.
Making a graphic organizer in Cloudairy is super easy. Even if you never made a diagram before, you can start by picking a template that fits your job.
When the template opens up, you can change whatever you like shapes, colors, words, icons, and lines. This lets you make a clear, neat diagram in your own fun style.
Cloudairy keeps your diagram tidy on its own. When you move or make something bigger, everything stays lined up just right, so your work looks clean and pro.
You can also add your brand colors or logo. Teams and classrooms can work on the same diagram together right then, making it easy to share ideas.
When done, you can save the organizer in lots of formats, pop it into talks or papers, or copy it for later. This makes sharing dead simple.
Cloudairy makes graphic organizing simple, fast, and way better.
Graphic organizers are helpful tools that people of all ages and jobs can use. They show info in a picture way, which makes it easier to get and share.
In schools, teachers use graphic organizers to explain lessons, teach new words, show science stuff, and help kids plan their writing. Students use them to learn quicker and remember hard topics.
In offices, graphic organizers help teams plan jobs, map sprints, get customers, check rivals, and make smarter picks for all kinds of projects.
UX teams, project bosses, and researchers use them to show user paths, build people profiles, get processes, spot issues, and sort data nice and clear.
Cloudairy makes all this super simple with easy picture tools, team work features, and ready templates. This helps folks brainstorm ideas, plan work, check info, and teach ideas better.
Graphic Organizers for Education
Cloudairy boosts class fun by making organizers hands-on and team-ready.
In business, graphic organizers help teams stay organized. They make it easy to plan work, make choices, and see what needs doing.
Teams use them for product plans, sprint planning, customer paths, and other big tasks that keep a company running smooth and growing.
Marketing teams use these charts to plan ad campaigns and get customers. Operations teams use them to make SOPs and fix workflow snags.
Sales teams use graphic organizers to map accounts and understand customer types. This makes talking and planning way easier.
Cloudairy makes all this super simple with ready templates, team features, and easy save options. It helps every group use graphic organizers no hassle.
.webp)
Cloudairy makes UX papers faster, clearer, and team-friendly.
Cloudairy gives you tons of advanced graphic organizer templates for special jobs. These beat simple ones like Venn diagrams or mind maps, and help with big planning and learning needs.
These templates pack cool business and strategy tools like SWOT Analysis, PESTLE Diagram, Business Model Canvas, Journey Maps, House of Quality, Causal Loop Diagrams, and team structure charts.
Each template starts ready to go, but you can tweak it all you want. Move parts around, add new bits, change branches, and toss in data or notes for super clear sharing.
These fancy organizers help teams plan huge projects, run strategy chats, check how things went, and show key ideas nice and clearly across all groups.
Teachers love them too for breaking down tough stuff. With Cloudairy’s branding and team features, these templates rock for papers, planning, and smart picks.
Cloudairy makes teams match up perfectly with easy team features.
When your graphic organizer is done, Cloudairy makes sharing super easy. You can save it in lots of ways and use it anywhere.
You can download your picture as PDF, PNG, JPG, or SVG. This makes it simple to add to reports, slides, school stuff, or work papers.
Cloudairy also gives embed codes, so your diagram shows up right on websites, online classes, or company pages.
You can copy your organizer and save different kinds. This helps when you need a fresh one for meetings, talks, or tests.
Exporting keeps sharing dead simple for teachers, kids, teams, and pros so everyone sees the same clean, neat diagram.
Graphic organizers are super helpful tools. They make the info clear, easy to get, and simple to plan. Folks use them in schools, offices, and tons of other spots.
Teachers, designers, and project leads use graphic organizers to split big ideas into little bits and make clear steps for work.
Cloudairy makes this dead easy with ready templates, drag-and-drop tools, tweak options, team features, and simple save picks.
These perks help users whip up neat diagrams that boost getting stuff, talking, and smart choices for kids and teams alike.
By grabbing a template, fixing it up, and sharing, anyone can make a clear, handy graphic organizer with Cloudairy.
Try Cloudairy Free and Start Building Your Graphic Organizers Today.
Are graphic organizers only for education?
Do I need design skills?
Can I use Cloudairy for team projects?
Are graphic organizers customizable?
Can I export my work?
Start using Cloudairy to design diagrams, documents, and workflows instantly. Harness AI to brainstorm, plan, and build—all in one platform.
Table of Contents

Introduction
 Manage all your work in one placeCollaborate with your teamUse Cloudairy for FREE—forever