Data Flow Diagram Template

Cloudairy
AI Workspace for Diagrams & Collaboration
Get your team started in minutes
Sign up with your work email for seamless collaboration.
Whiteboard
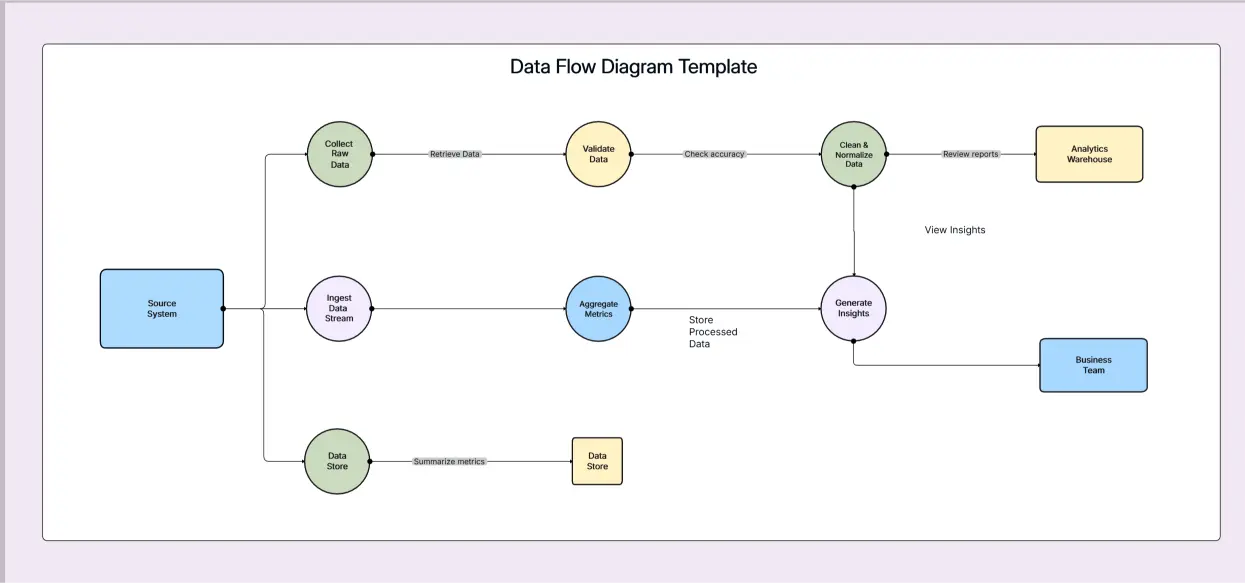
Use this Data Flow Diagram template to clearly visualize processes, data flow, and system interactions. Perfect for software development, business analysis, and system planning. Design structured, easy-to-understand DFDs that improve communication and project clarity.
Use this Data Flow Diagram template to clearly visualize processes, data flow, and system interactions. Perfect for software development, business analysis, and system planning. Design structured, easy-to-understand DFDs that improve communication and project clarity.
The Data Flow Diagram Template enables you to see the entire data movement process throughout a system. The diagram shows the starting points of data and its processing methods and storage locations and final destinations. The structured diagram provides teams with complete process understanding without the need to read lengthy technical documents.
Software development and system analysis and business process planning rely extensively on Data Flow Diagrams which people usually refer to as DFDs. The system enables users to create complex workflows which become easy to understand by both technical experts and people who lack technical knowledge.
The template includes pre-designed elements which represent processes and data stores and external entities and data flows. You can quickly customize it to match your system or workflow. The solution enables you to create diagrams which follow basic structural rules while saving time.
A Data Flow Diagram focuses on the movement of data. It does not describe technical code or system architecture. Instead, it explains how information flows within a system.
There are four main components in a Data Flow Diagram:
1. External Entities
These are outside systems, users, or organizations that interact with your system. They send or receive data.
2. Processes
Processes transform data. They take input, perform actions, and produce output.
3. Data Stores
Data stores represent where information is kept. This can be databases, files, or storage systems.
4. Data Flows
Data flows are arrows that show how information moves between entities, processes, and data stores.
Using a structured Data Flow Diagram Template ensures your diagram remains clear and professional. It also helps maintain consistency across projects.
A Data Flow Diagram Template improves collaboration and understanding across teams.
Improves Communication
Visual diagrams are easier to understand than written descriptions. Team members can quickly see how data flows through the system.
Identifies Gaps and Errors
When processes are mapped visually, missing steps become obvious. It also helps identify duplicate processes or inefficiencies.
Supports System Planning
Before building software, teams can use a Data Flow Diagram to plan data handling. This reduces errors during development.
Aligns Business and Technical Teams
Business stakeholders focus on goals. Developers focus on implementation. A DFD bridges the gap by providing a shared visual understanding.
Creating a Data Flow Diagram using the template is simple. Follow these steps:
Step 1: Define the System Scope
Clearly decide what process or system you want to map. Keep the focus narrow to avoid confusion.
Step 2: Identify External Entities
Add users, third-party services, or systems that interact with your process.
Step 3: Add Processes
Insert processes that transform data. Use clear action-based names like “Process Order” or “Validate User.”
Step 4: Add Data Stores
Show where information is stored. This can include databases or internal systems.
Step 5: Connect Data Flows
Use arrows to represent how data moves between elements. Label each arrow clearly.
Step 6: Review and Simplify
Check if the diagram reflects the actual workflow. Remove unnecessary details. Keep it readable.
You can also create multiple levels. A Level 0 diagram shows a high-level overview. Level 1 or Level 2 diagrams show more detailed processes.
A Data Flow Diagram is useful in many situations.
During Software Development
Before writing code, developers use DFDs to understand system logic and data handling.
During Business Process Analysis
Organizations use DFDs to document workflows and improve operational efficiency.
During System Migration
When upgrading or replacing systems, a DFD shows how data currently flows. This helps ensure smooth transitions.
During Security Planning
Mapping data movement helps identify where sensitive information is stored or transmitted. This improves risk assessment.
During Compliance Audits
Many industries require clear documentation of data handling. A Data Flow Diagram supports compliance efforts.
Creating an effective Data Flow Diagram requires clarity and structure.
Keep It Simple
Avoid adding too many elements in one diagram. If it becomes complex, break it into multiple levels.
Use Clear Labels
Each process and data flow should have a clear name. Avoid vague descriptions.
Maintain Logical Direction
Data should flow logically from input to output. Keep arrows organized and avoid crossing lines where possible.
Follow Standard Symbols
Use consistent shapes for processes, data stores, and entities. This keeps the diagram professional and easy to read.
Validate with Stakeholders
Review the diagram with team members. Confirm accuracy before finalizing.
The Data Flow Diagram Template provides multiple essential advantages to its users. The system displays complete workflow information through its visual representation.
A Data Flow Diagram Template serves as an effective instrument which enables users to study data movement throughout a system. The system provides better understanding of intricate processes. The system enables teams to comprehend all aspects of their work without any uncertainty. The process requires you to map all components which include processes, data stores and external entities and data flows. The structure enables organizations to enhance their planning activities and development processes and their communication practices. The system reduces mistakes while it simultaneously boosts productivity.
The Data Flow Diagram simplifies all your work requirements because it enables you to create visual diagrams which show your data flow. The tool enables teams to work together while they reach their shared objectives and choose optimal solutions. Start using the Data Flow Diagram Template to organize your system logic clearly and move your projects forward with confidence.
What is a Data Flow Diagram Template?
It is a pre-designed layout that helps you create structured Data Flow Diagrams quickly and accurately.
What is the difference between a flowchart and a Data Flow Diagram?
A flowchart focuses on process steps. A Data Flow Diagram focuses on how data moves between processes and systems.
Who should use this template?
Business analysts, software developers, project managers, and system architects can benefit from this template.
Can beginners use a Data Flow Diagram Template?
Yes. The template is simple and easy to follow. It does not require advanced technical knowledge.
Is it suitable for complex systems?
Yes. You can create multi-level diagrams to represent complex systems in detail.
Loading subcategories...
 Manage all your work in one place
Collaborate with your team
Use Cloudairy for FREE—forever
Explore More