Technical Diagramming
What is a Workflow Diagram? Examples and Types

AI Workspace for Diagrams & Collaboration
Get your team started in minutes
Sign up with your work email for seamless collaboration.
A workflow diagram is a visual map that depicts the manner in which the tasks, decisions and processes move from beginning to the end in a firm. It is beneficial in clarifying the responsibilities, the transfer points and the movement of data or materials in a given process to the whole team.Workflow diagrams disclose the unproductive areas, define the duties and are the starting point for the activities such as automation, optimization and scaling by splitting the operations into successive steps.
In this day and age, where the working environment is so fast and hectic, it is indispensable to have a clear understanding of the situation. The use of workflow diagrams enables the groups to see the difficult procedures that would otherwise be hidden in the Excel sheets or reports.
So, they create better inter-departmental communication, cut down duplications and give the same point of reference of how the work is done. Be it a marketing campaign development or production line designing, the presence of a clear workflow diagram keeps the whole situation in alignment and visibility.
Different teams use different diagram styles depending on their purpose, complexity, and audience. Here are some of the most common types you’ll encounter — each serving a unique function within the workflow ecosystem.
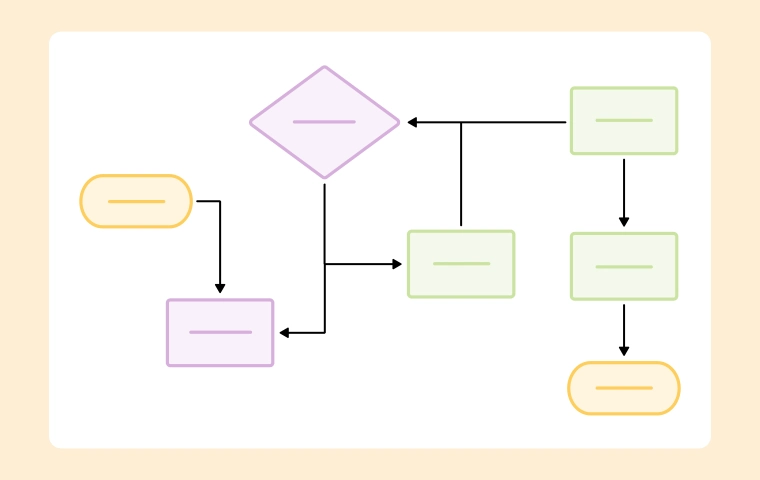
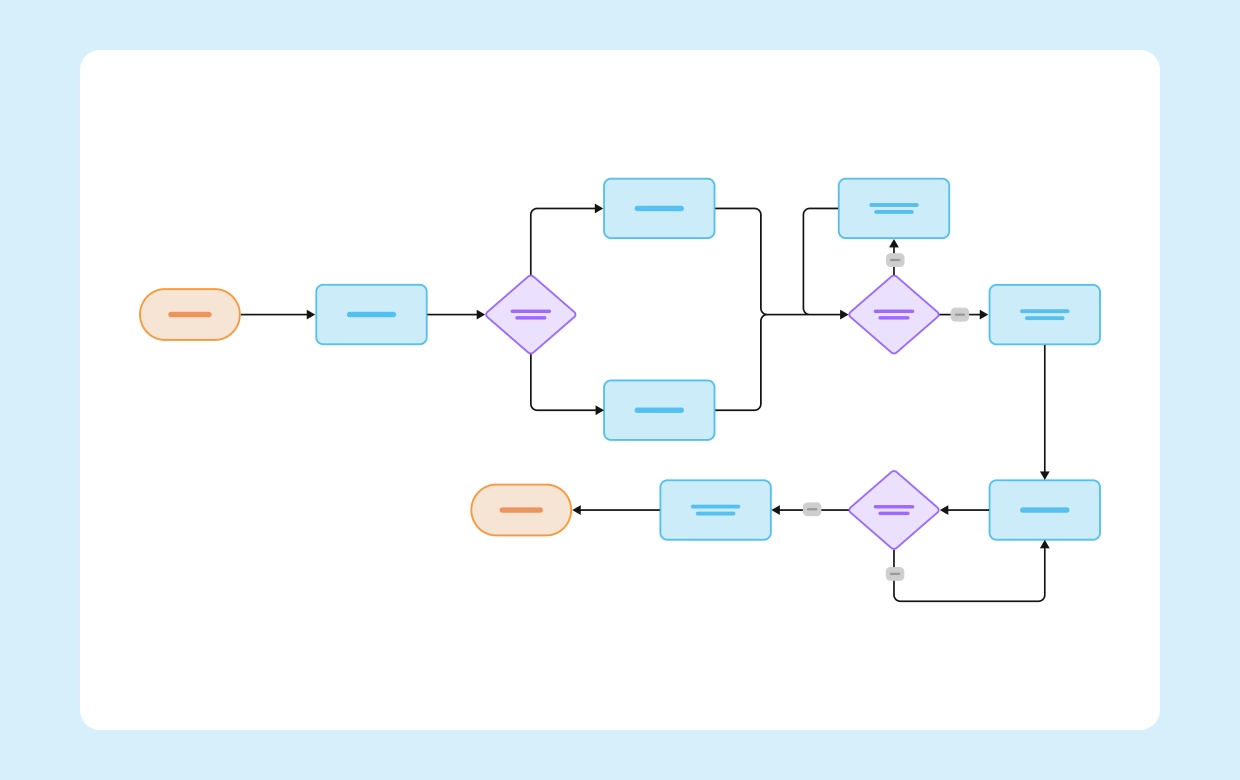
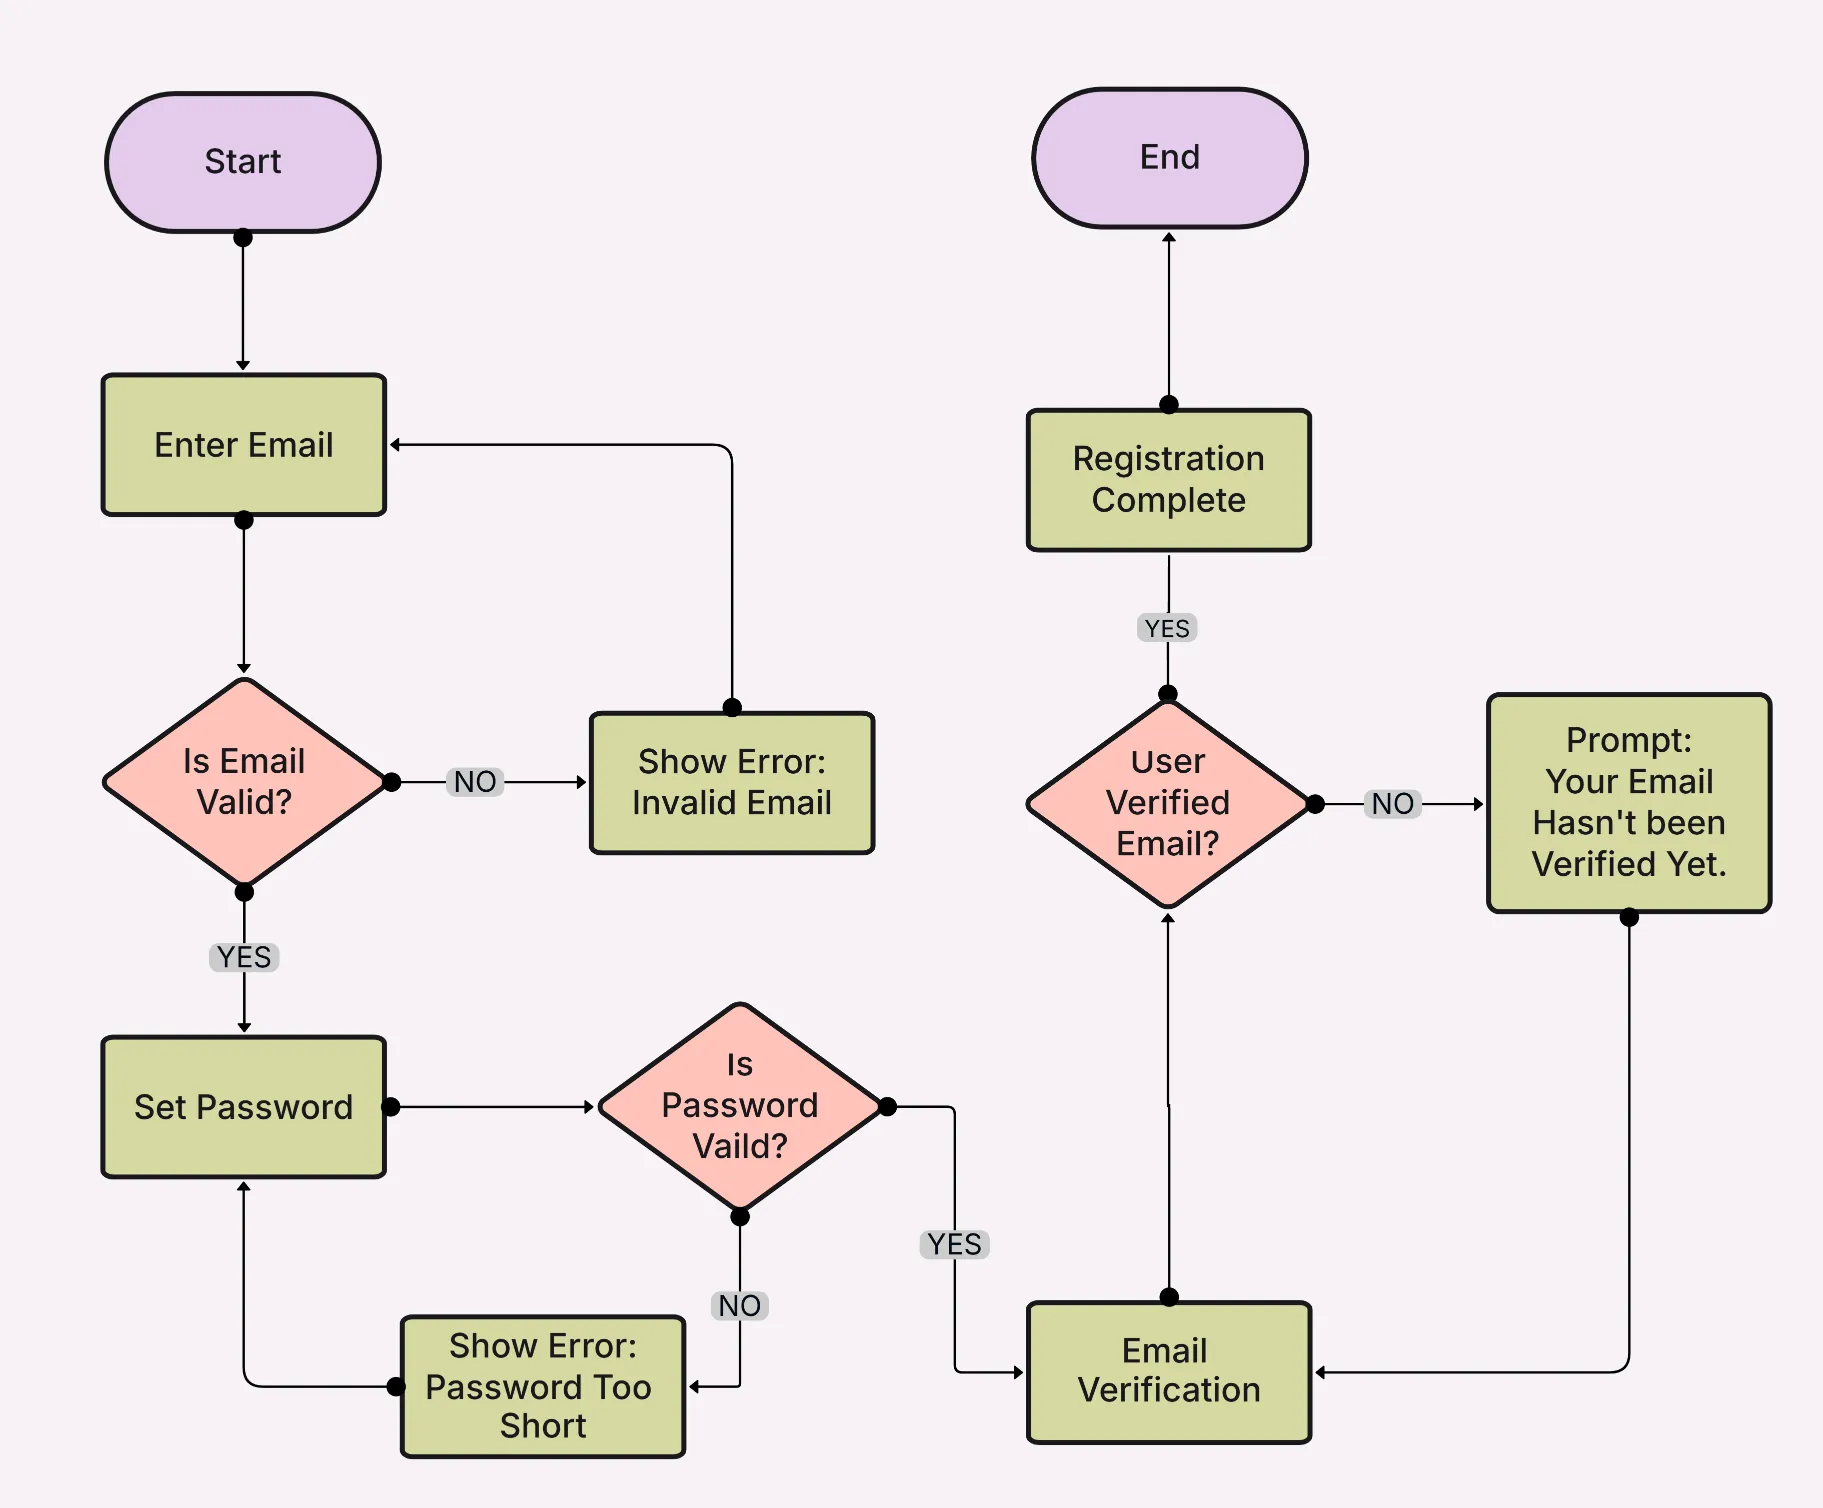
A flow diagram illustrates step-by-step logic and decision paths within a process. It’s often used in software design, business processes, and Agile development to define actions and conditional outcomes.
Explore the Flow Diagram Template or read the Flow Diagrams in Agile Teams Blog to see how Agile teams use them for sprints and process logic.
Explore the Flow Diagram Template or read the Flow Diagrams in Agile Teams Blog to see how Agile teams use them for sprints and process logic.
.webp)
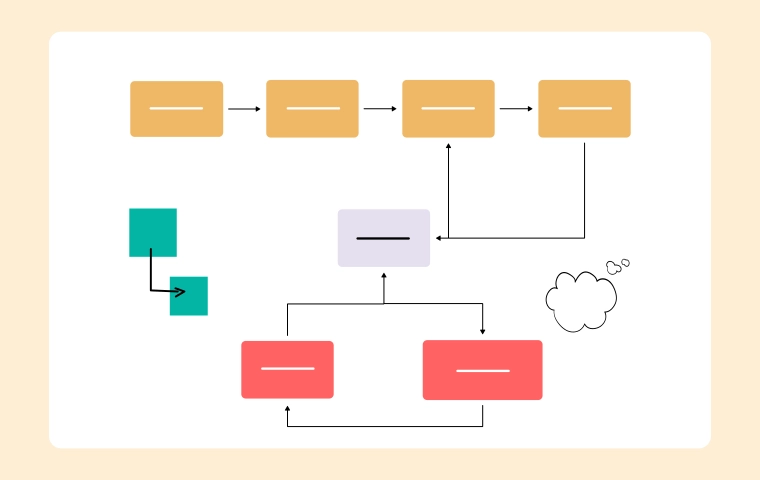
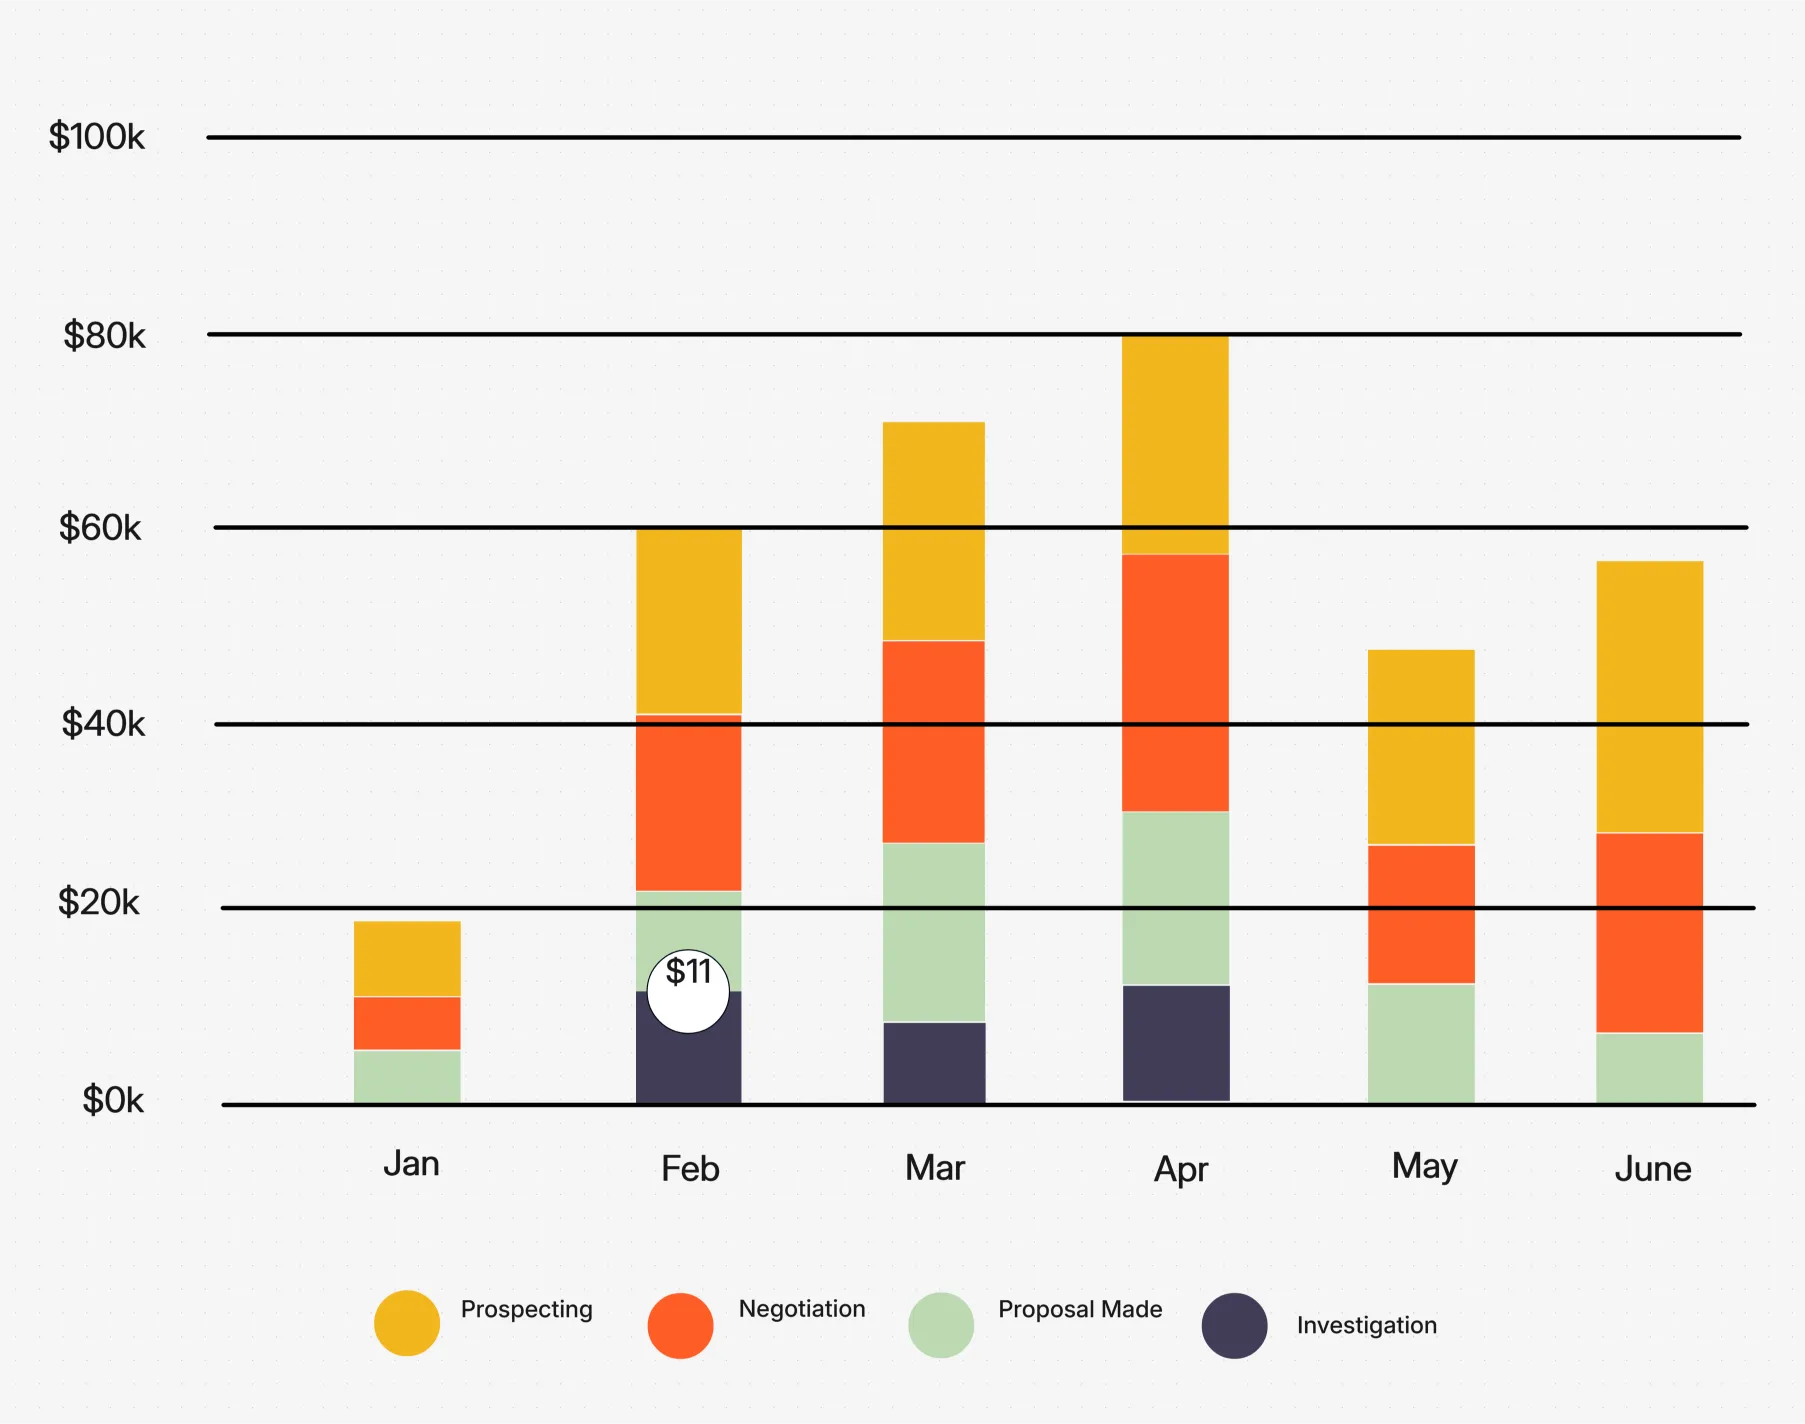
The bar diagram focuses on comparing performance metrics, project milestones, or departmental outputs. While not a process flow in itself, it complements workflow diagrams by visualizing results and performance over time.
Try the Bar Diagram Template to create visual reports that track growth, efficiency, or progress in your workflow metrics.
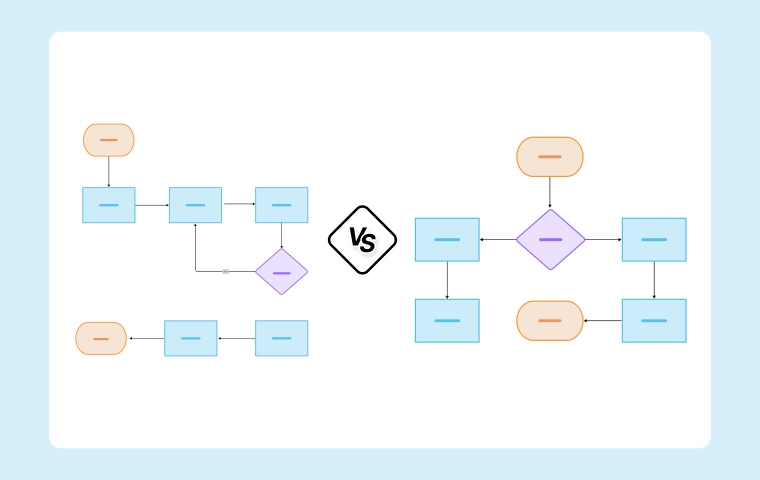
A tape diagram is a simplified visual used to show proportional relationships or resource allocations. It’s especially helpful when mapping project budgets, time distribution, or shared capacities.
View the Tape Diagram Example to visualize resource planning and allocation scenarios.
Workflow diagrams are a tool that not only helps routine operations but also brings structure and visibility to them, thus enabling teams to make better decisions and assist each other in a better way.
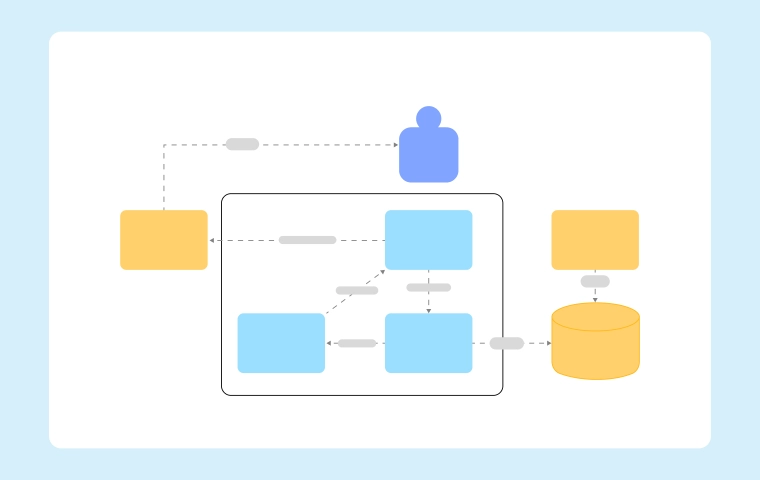
Workflow diagrams become supportive tools in situations where multiple stakeholders, stages, or decision-making points are involved in the process.
The creation of a workflow diagram that serves its purpose well is easy when you have a specialized tool at your disposal. The following are the steps to be followed:
Create diagrams easily with pre-built templates and visual automation tools using the Workflow & Process Diagram Maker.
No matter the sector, workflow diagrams provide more transparency, order, and understanding to each process. By facilitating a visual connection of people, data, and operations, they enable organizations to shift from uncertainty to accuracy.
With Cloudairy's Workflow & Process Diagram Maker, you can start visualizing your own processes and take a look at related templates such as the Flow Diagram Template and Bar Diagram Template for your inspiration.
1. What’s the main difference between a workflow diagram and a process map?
2. How often should workflows be updated?
3. Can I use workflow diagrams for automation?
4. What teams benefit most from workflow diagrams?
5. Which tool is best for creating workflow diagrams?
Start using Cloudairy to design diagrams, documents, and workflows instantly. Harness AI to brainstorm, plan, and build—all in one platform.
Table of Contents

Introduction
 Manage all your work in one placeCollaborate with your teamUse Cloudairy for FREE—forever


 Related Articles
.webp)