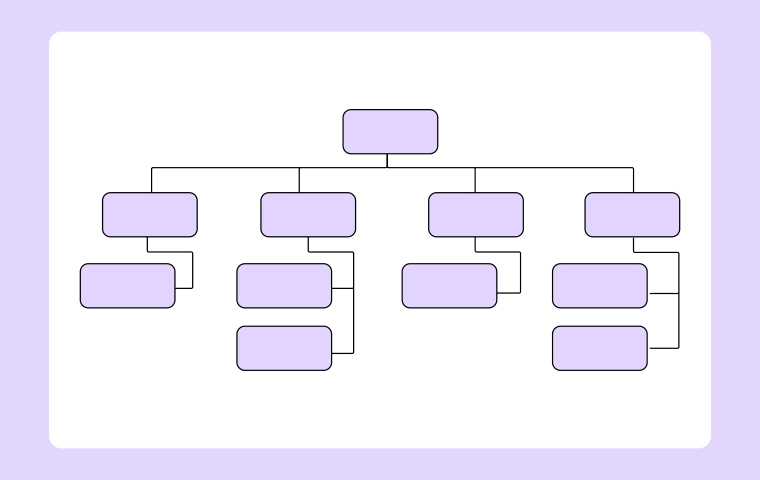
Org Chart
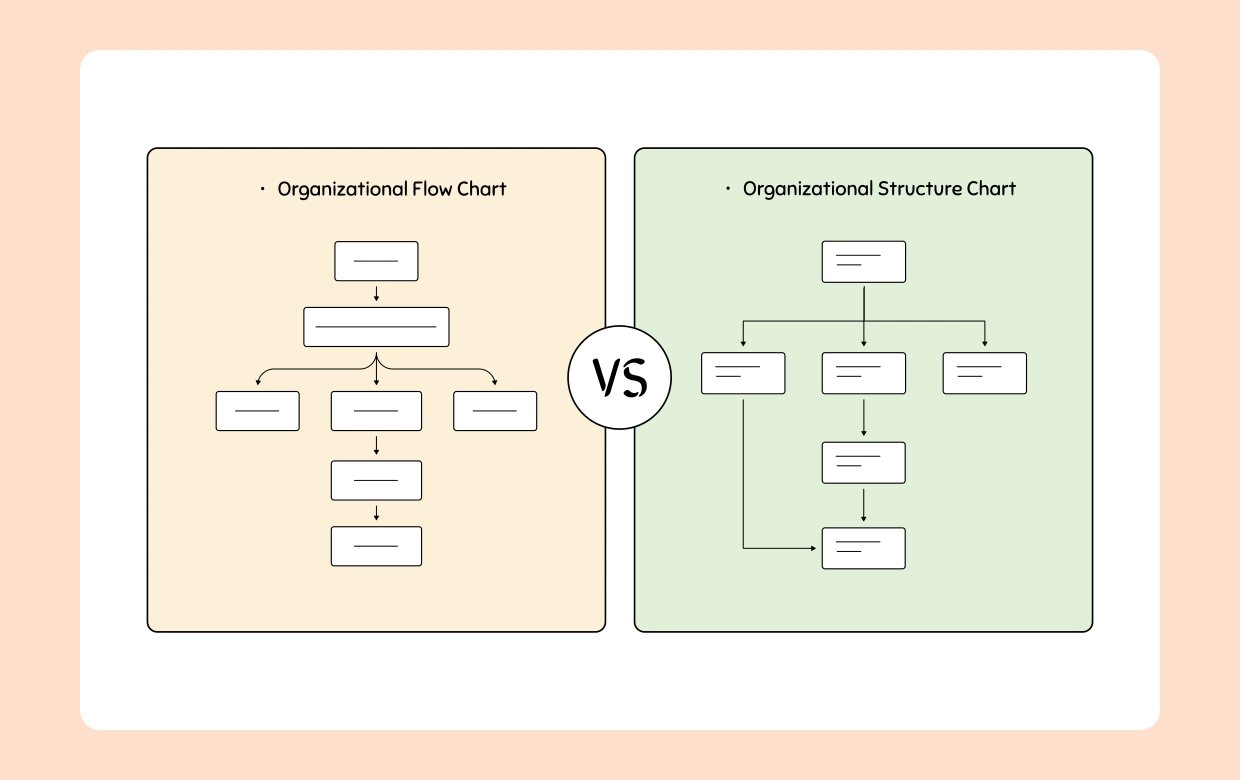
Organizational Flow Chart vs Organizational Structure Diagram

AI Workspace for Diagrams & Collaboration
Get your team started in minutes
Sign up with your work email for seamless collaboration.
Different teams sometimes might mean the same thing by the terms "organizational flow chart" and "organizational structure diagram" nevertheless, they are usually applied for different purposes. Both diagrams are used to depict how your company runs, but one emphasizes human resources and chain of command while the other illustrates flow and transfers.
This clarity is very important for creating diagrammatic tools that depict not only the communication lines but also the actual workflow.
In this article, we will explain the major differences between these two vital business diagrams, their appropriate use, and the role of Cloudairy in the process of making them easy, collaborative, and dynamic.
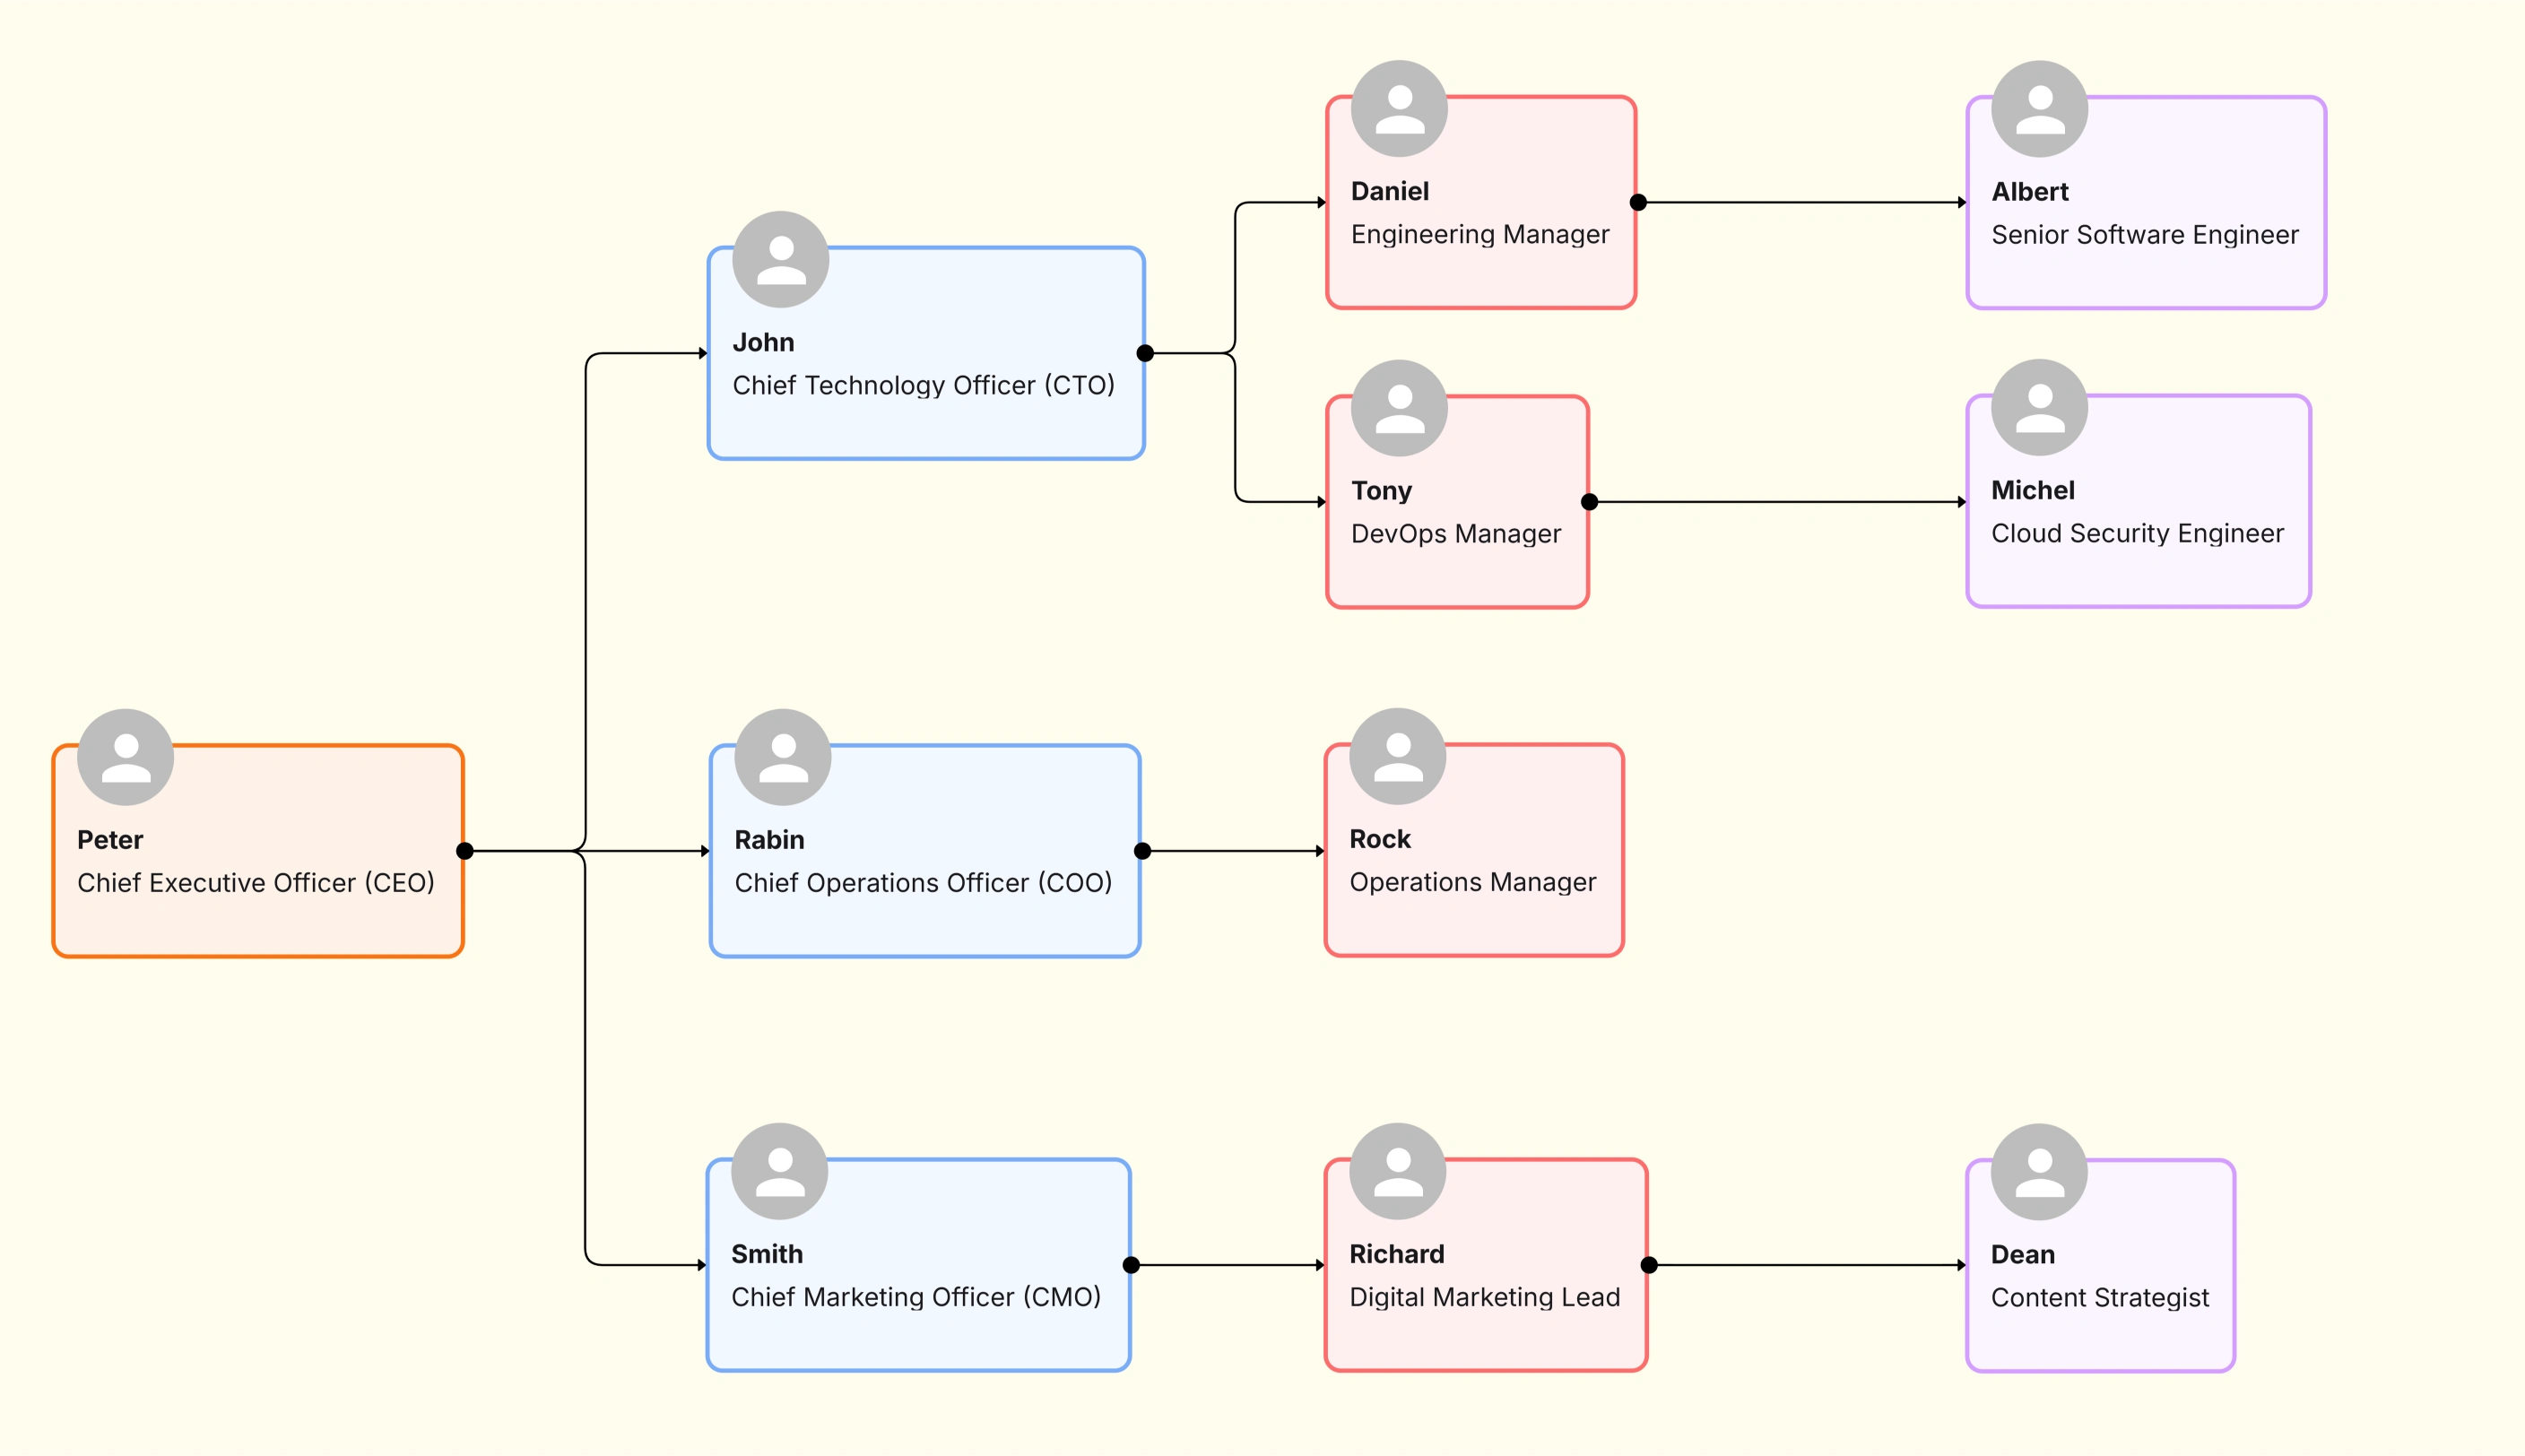
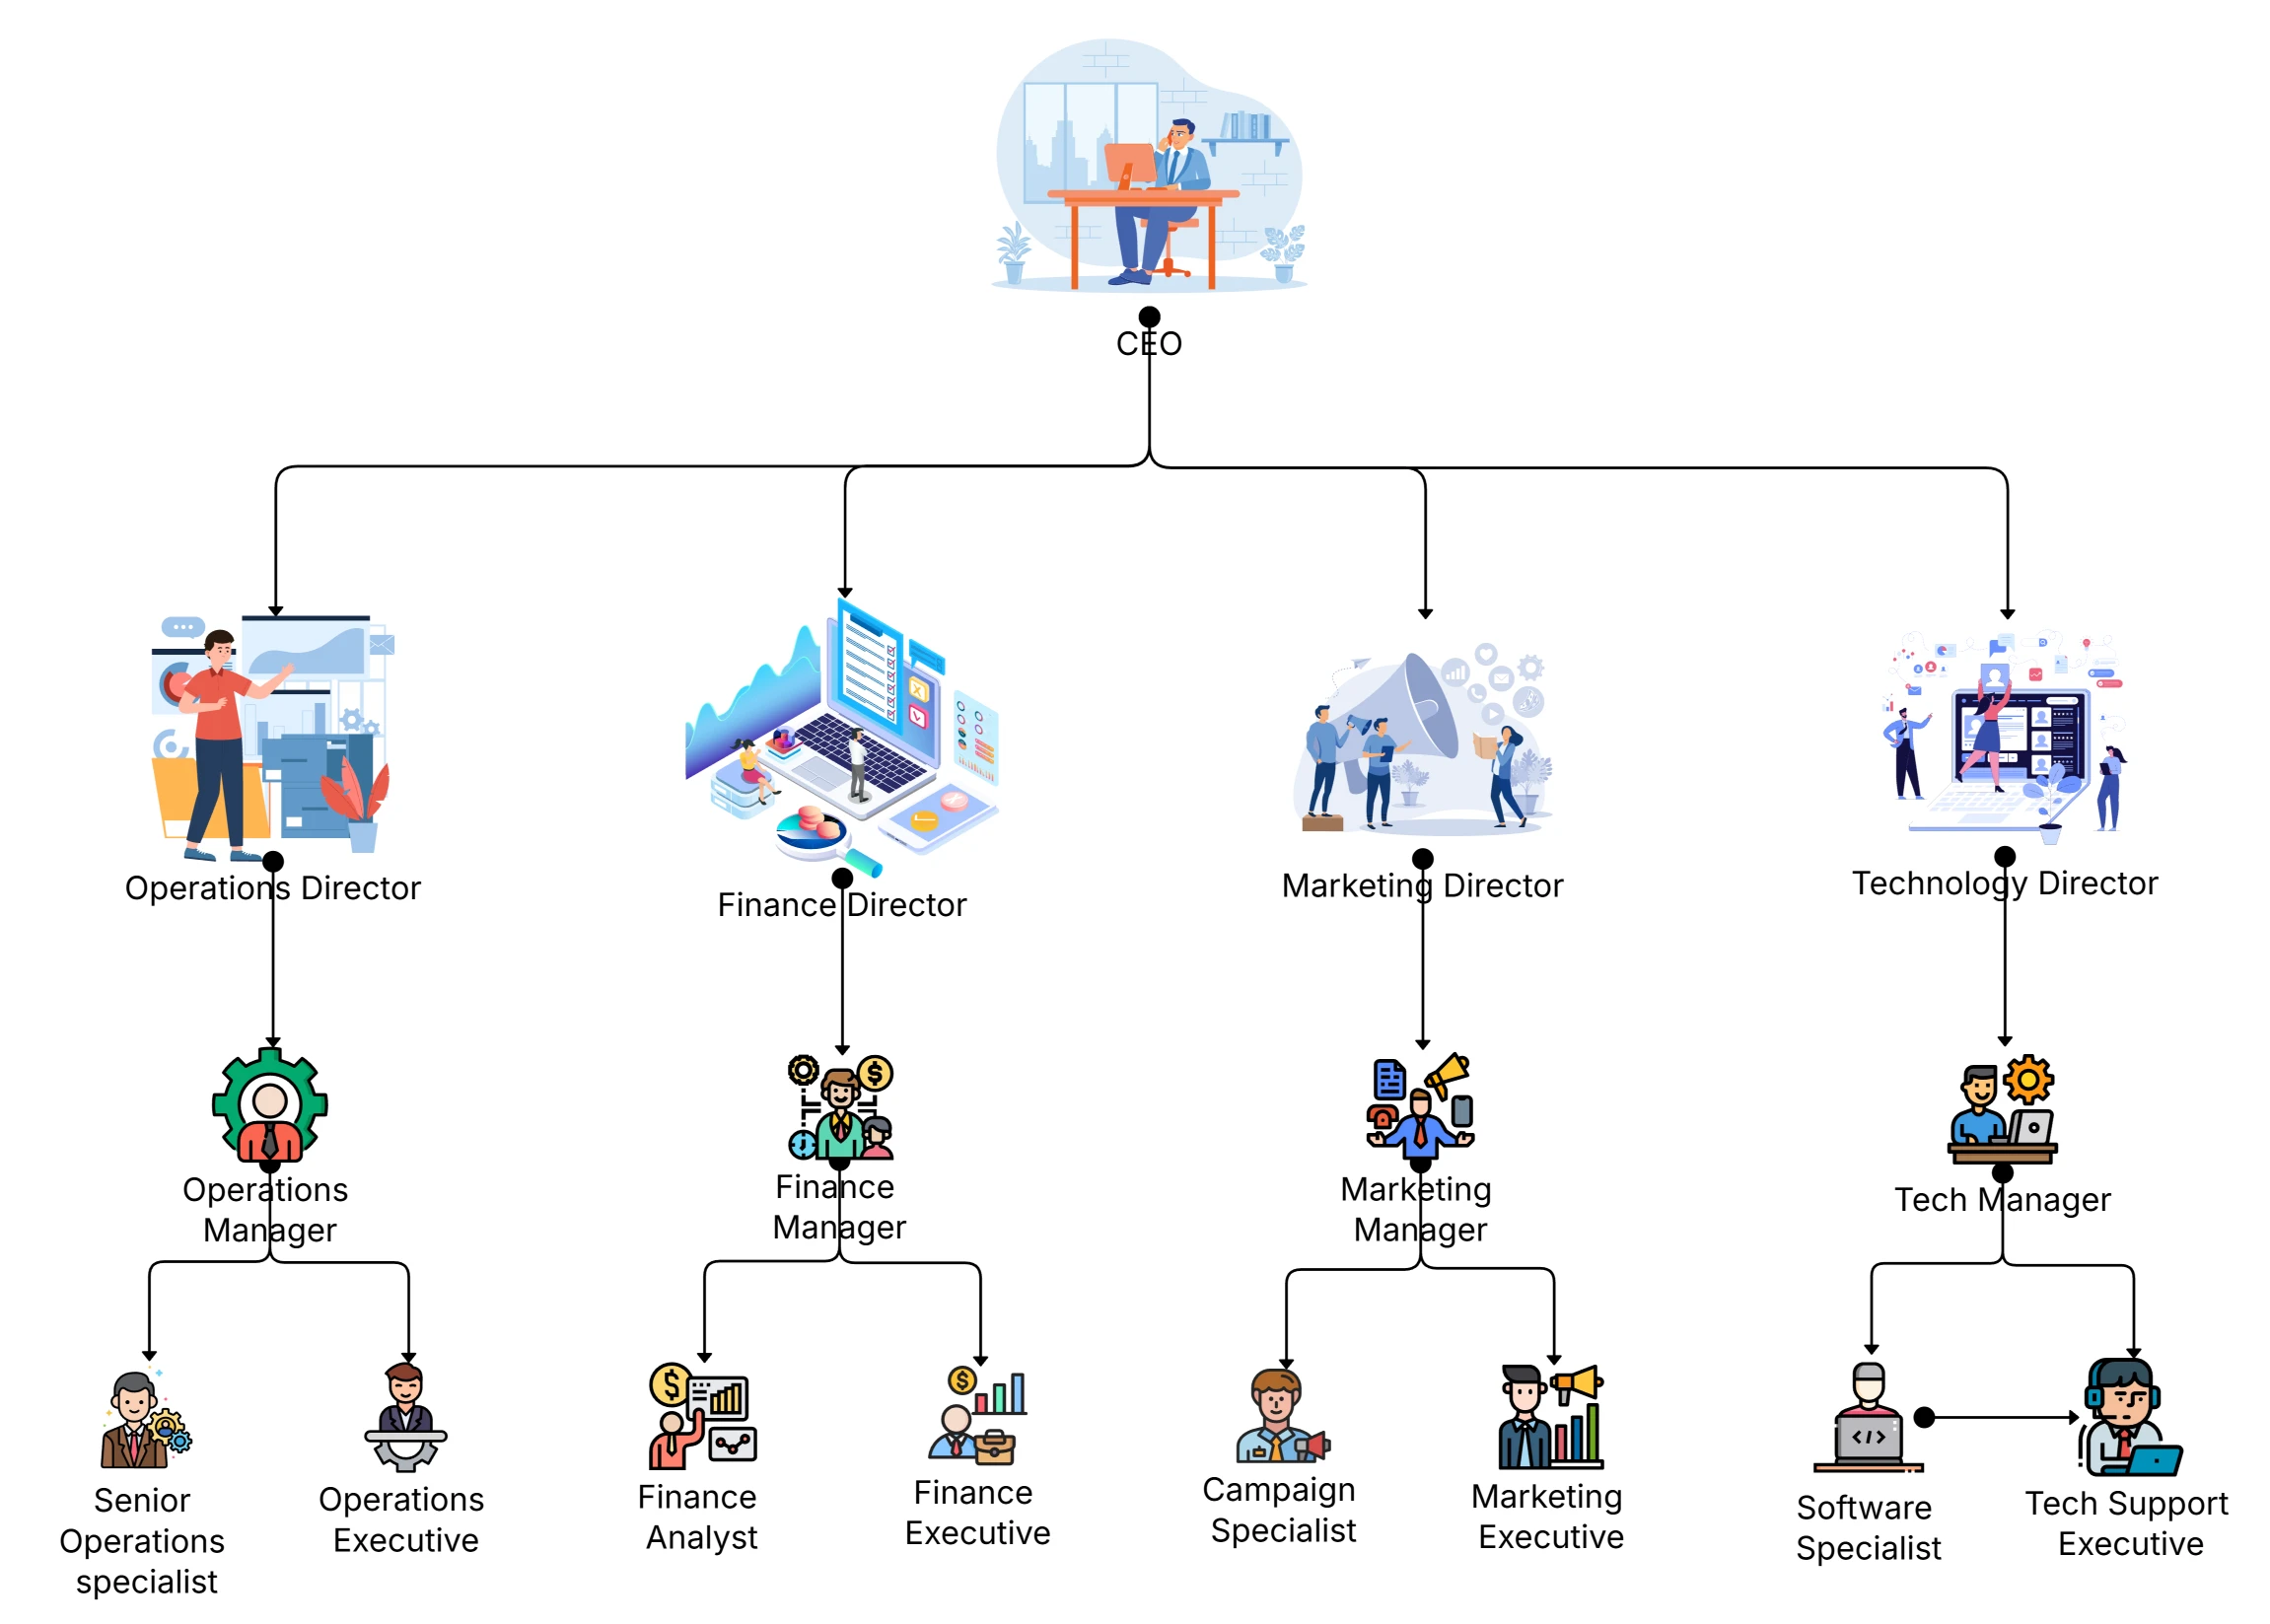
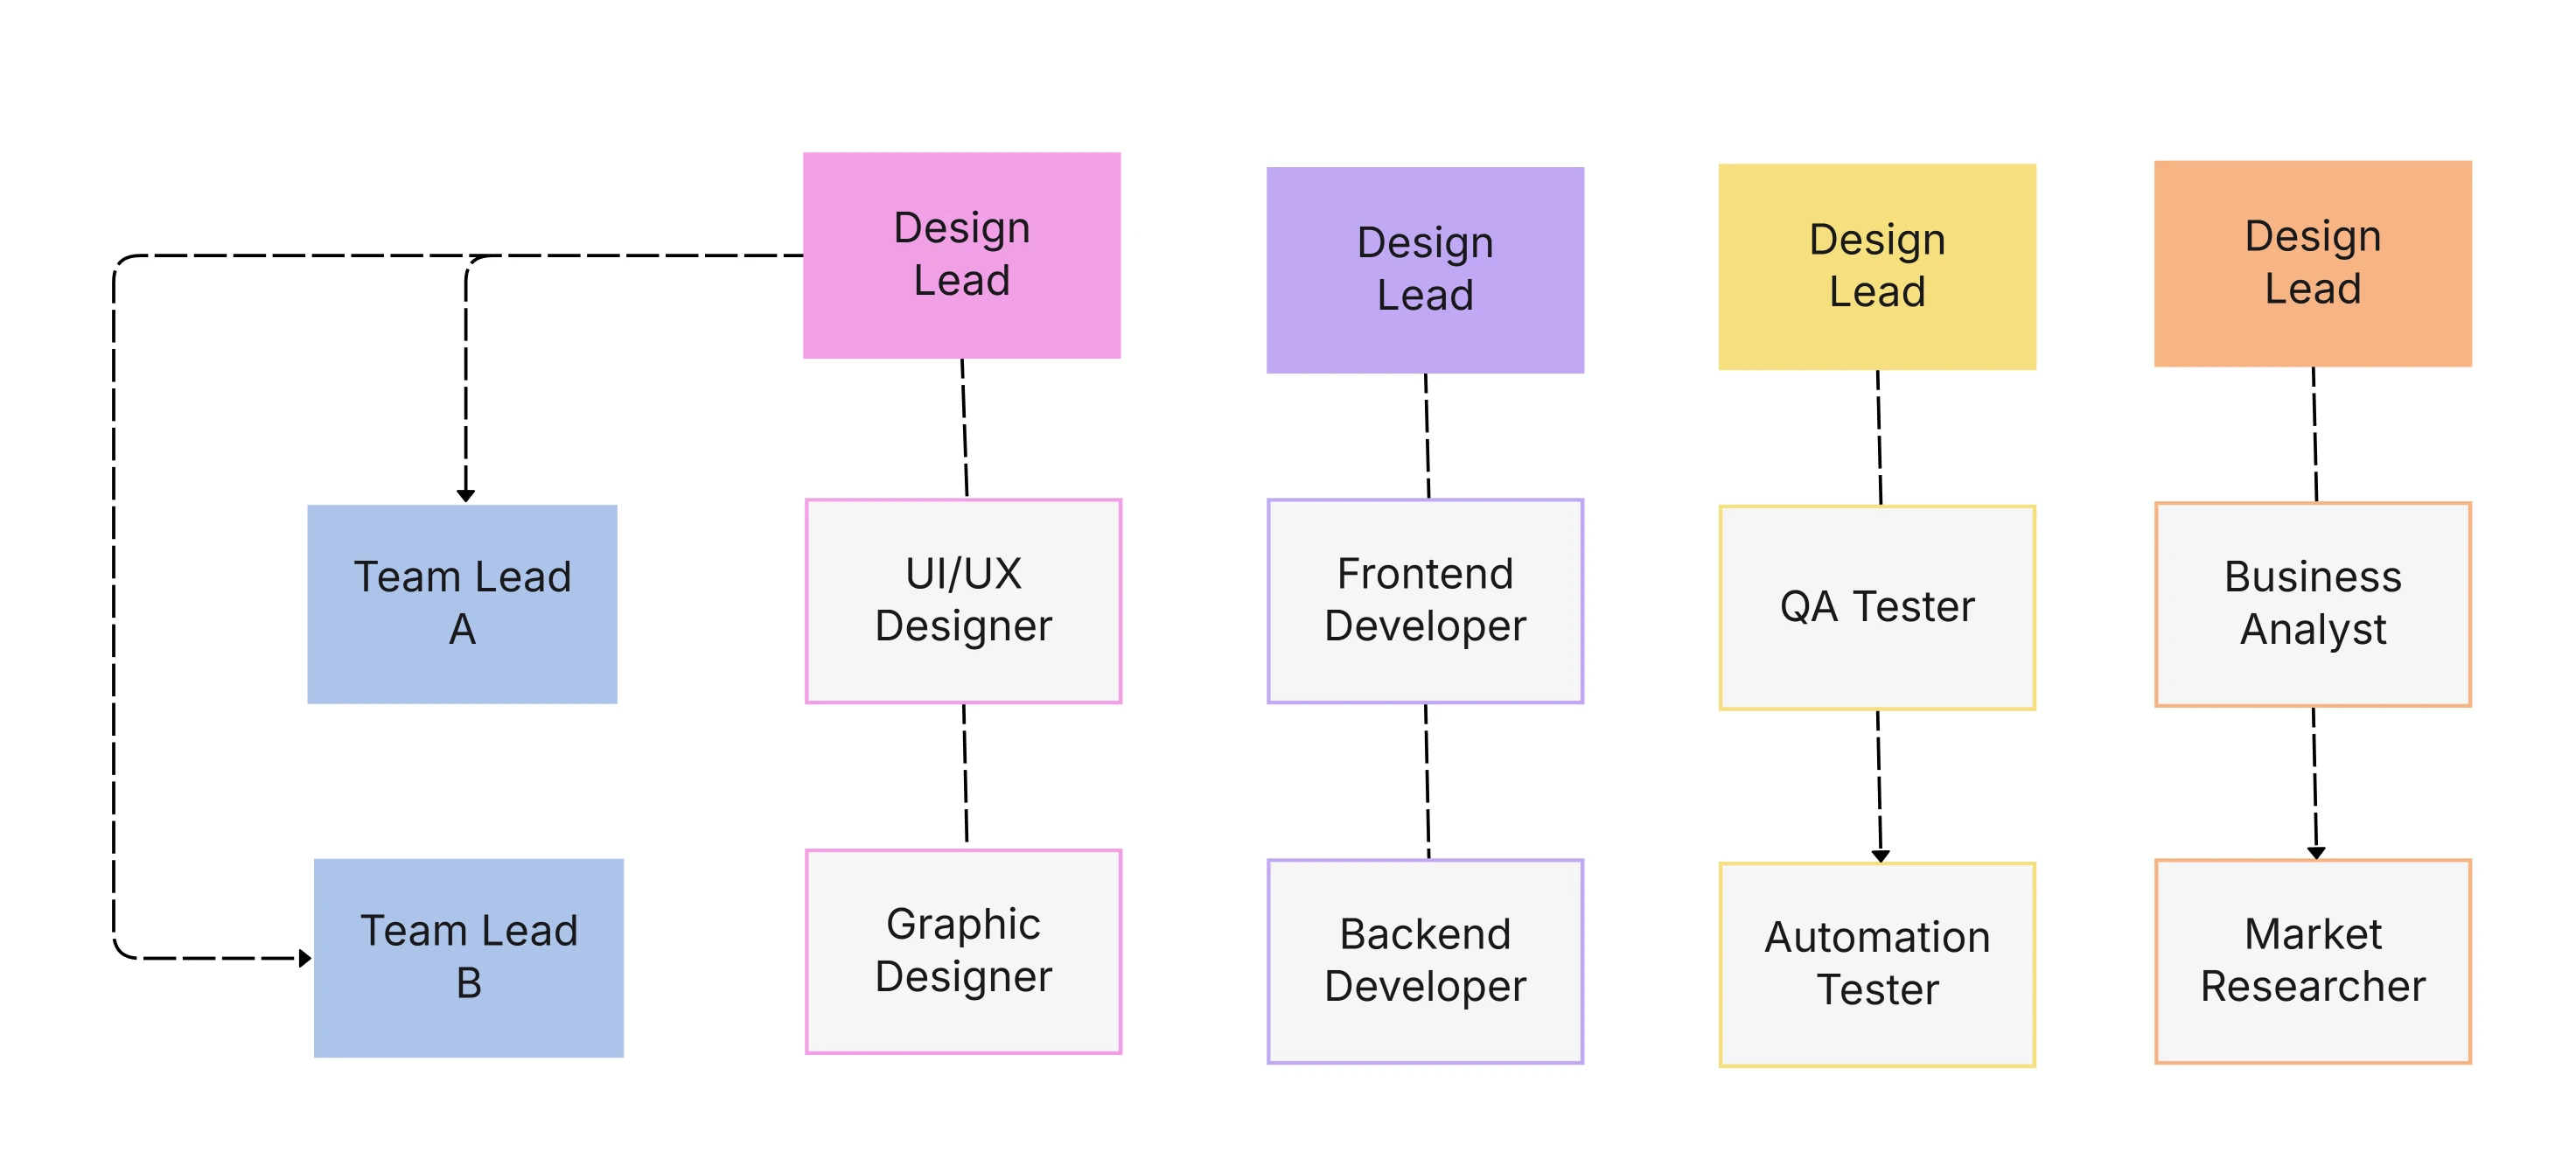
An organizational structure diagram often called an org chart focuses on hierarchy and reporting relationships. It’s the blueprint of your company’s people structure, showing who leads, who reports, and how teams connect.
At its core, it answers questions like:
These diagrams are essential for visualizing command, accountability, and team organization.
Each structure emphasizes the people side of your business how your teams are arranged and how authority flows.
Cloudairy’s Organizational Chart Layout Template and Design Template are great starting points to build these diagrams visually. They help you clarify hierarchy while keeping your layout clean and modern.
An organizational flow chart takes a different approach. Instead of showing hierarchy, it illustrates process flow how information, decisions, and actions move between individuals or departments.
While a structure diagram answers “Who reports to whom?”, a flow chart answers “How do tasks move through our organization?”
Let’s say you’re mapping your content marketing process. A flow chart might show:
This sequence illustrates workflow and dependencies not hierarchy.
Flow charts visualize process, not power. They highlight efficiency, reveal bottlenecks, and make it easier to improve cross-department collaboration.
With Cloudairy’s Organizational Flow Chart Template, you can design process-oriented visuals with arrows, connectors, and labeled nodes that clearly show how information moves through your organization.
Although both help clarify your organization, they do so from very different perspectives.
| Aspect | Organizational Structure Diagram | Organizational Flow Chart |
| Focus | People, hierarchy, and reporting relationships | Process flow, decisions, and communication paths |
| Purpose | Define authority and accountability | Visualize operations and workflows |
| Elements | Positions, departments, reporting lines | Actions, decisions, outcomes, connectors |
| Best For | Leadership mapping, team organization | Process optimization, efficiency audits |
| Layout Style | Hierarchical (top-down or matrix) | Sequential (left-to-right or vertical flow) |
If you imagine your organization as a living system, the structure diagram is its skeleton, while the flow chart represents its circulatory system. Both are essential for organizational health.
Use a structure diagram when you need to:
The aforementioned format stands out particularly for leadership presentations, HR planning, and company handbooks.
With the help of Cloudairy’s Organizational Chart Design Template, you can easily generate one in no time. It encompasses customizable nodes, color coding for departments, and automatic alignment for neat layouts.
Choose a flow chart when your goal is to:
Flow charts are most common in operational planning, process improvement, and team onboarding.
Within a customer service team, a flow chart can demonstrate the process of support tickets from submitting through to resolving indicating how various roles take part at every step.
Creating such visuals through Cloudairy allows teams to work together at the same time, propose changes, and mark the parts that require improvement without the need to reconstruct the diagram entirely.
The most successful organizations use both structure diagrams and flow charts together.
For example:
Together, they give a complete picture of your company’s inner workings who does what and how it gets done.
Pro Tip: Use Cloudairy to layer both diagrams side by side in one workspace. This visual pairing bridges the gap between authority and execution, making it easier for teams to understand the full context of their work.
Regularly revisiting these visuals keeps your teams aligned and processes efficient
While both diagrams help you visualize your organization, their purposes are distinct. An organizational structure diagram defines relationships and accountability, while an organizational flow chart shows the movement of work and decisions.
When combined, they form a powerful visual management toolkit giving leaders the clarity to design better systems and teams. To better understand how reporting relationships differ across departments and projects, explore our detailed comparison of functional vs matrix organizational structure.
Start building both today with Cloudairy’s Organizational Flow Chart Template for process mapping and the Organizational Chart Design Template for team structure. To explore the fundamentals of chart design, visit the Organizational Chart Examples & Design pillar page or download our report on Org Chart Design Trends for insights into modern structures.
Visualize structure and flow Try Cloudairy Free today.
Start using Cloudairy to design diagrams, documents, and workflows instantly. Harness AI to brainstorm, plan, and build—all in one platform.
Table of Contents

Introduction
 Manage all your work in one placeCollaborate with your teamUse Cloudairy for FREE—forever


 Related Articles


.webp)