Affinity Diagram Maker
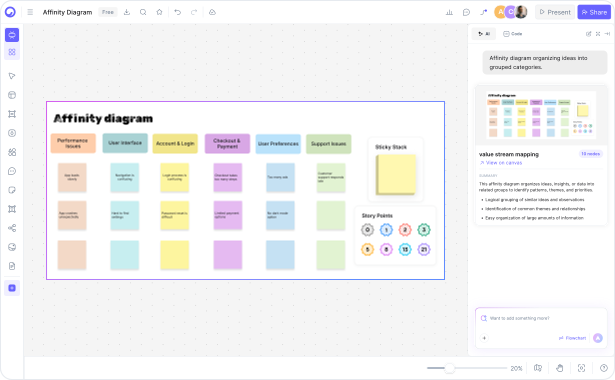
Affinity Diagram Maker — AI-Powered
Create affinity diagrams and KJ maps instantly with AI. Group ideas, find patterns, organize brainstorm data. No signup required. Free on Cloudairy.
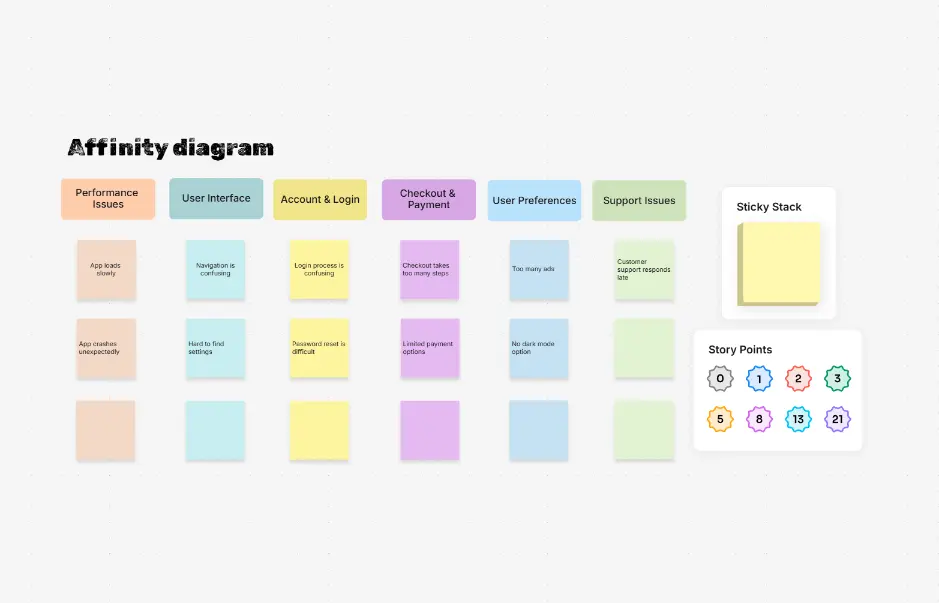
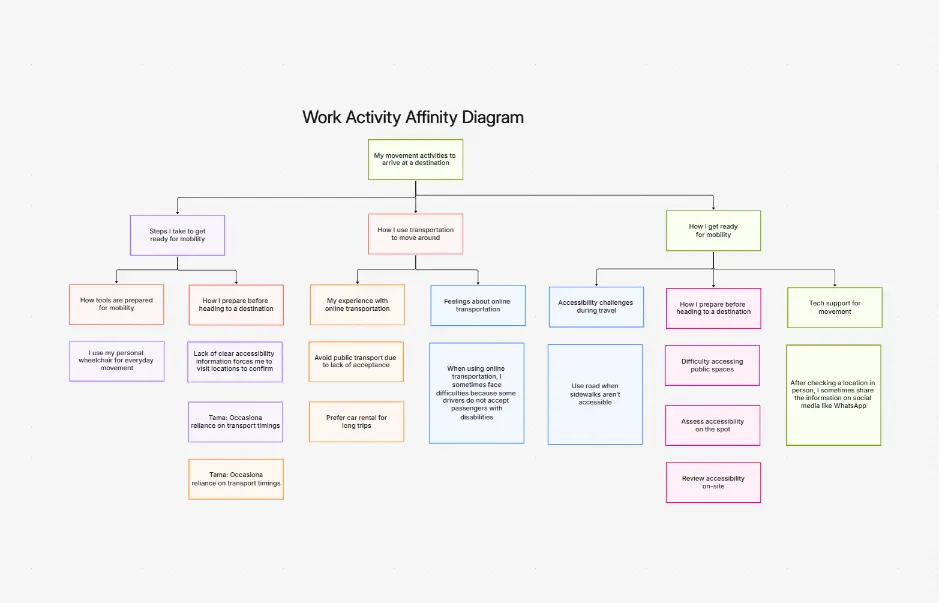
AI prompt-to-diagram — describe your research findings or brainstorm data in plain English
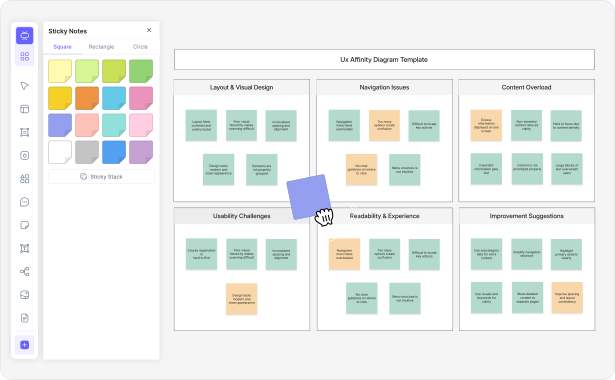
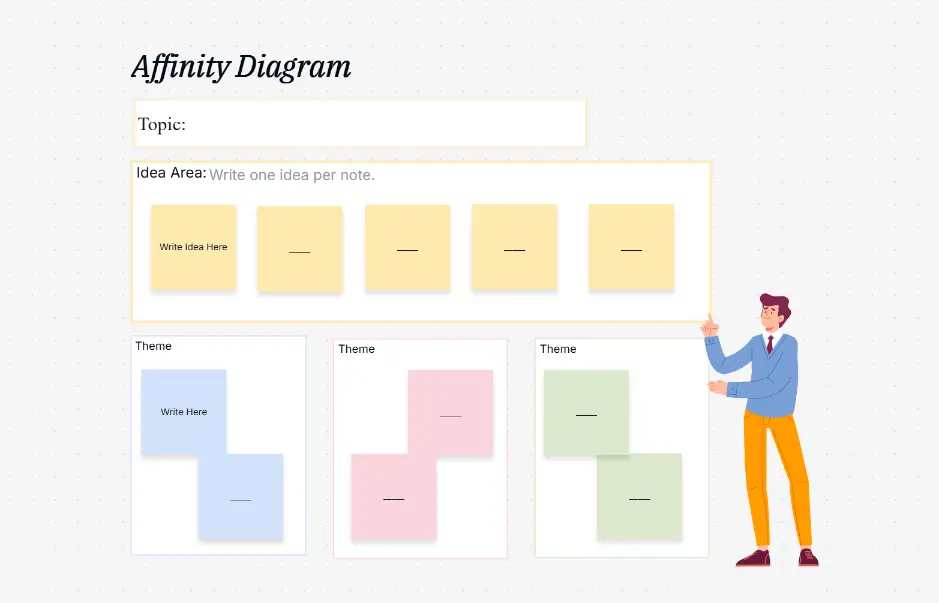
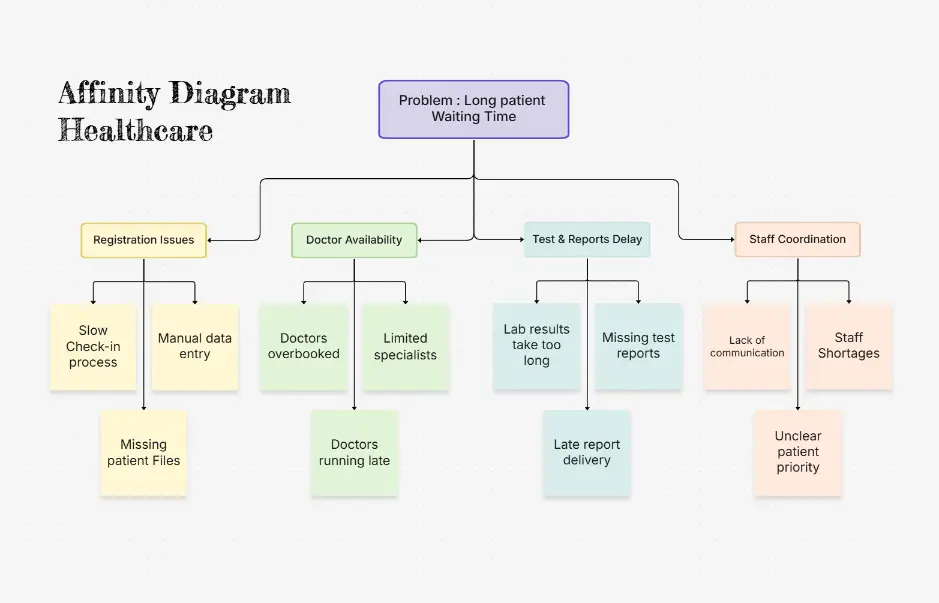
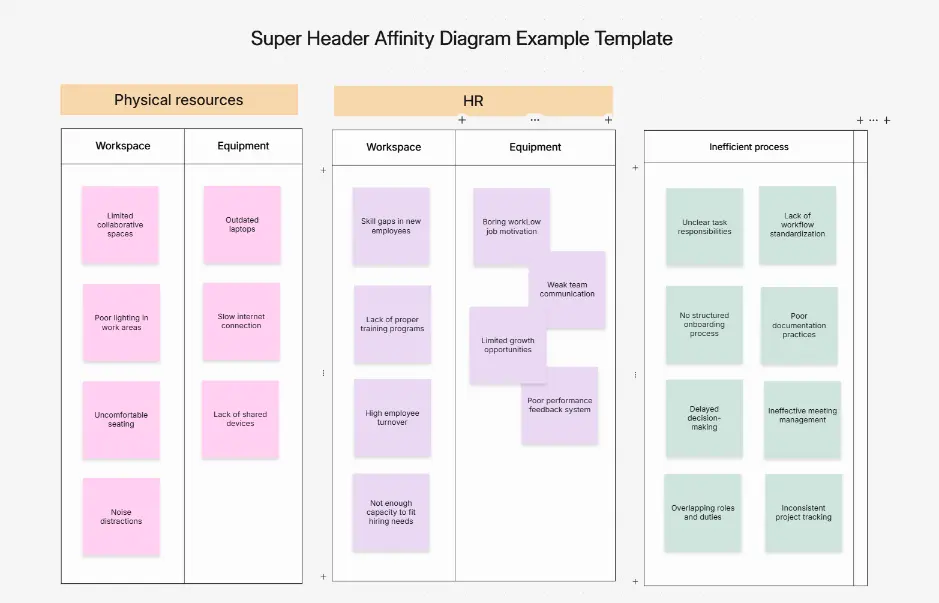
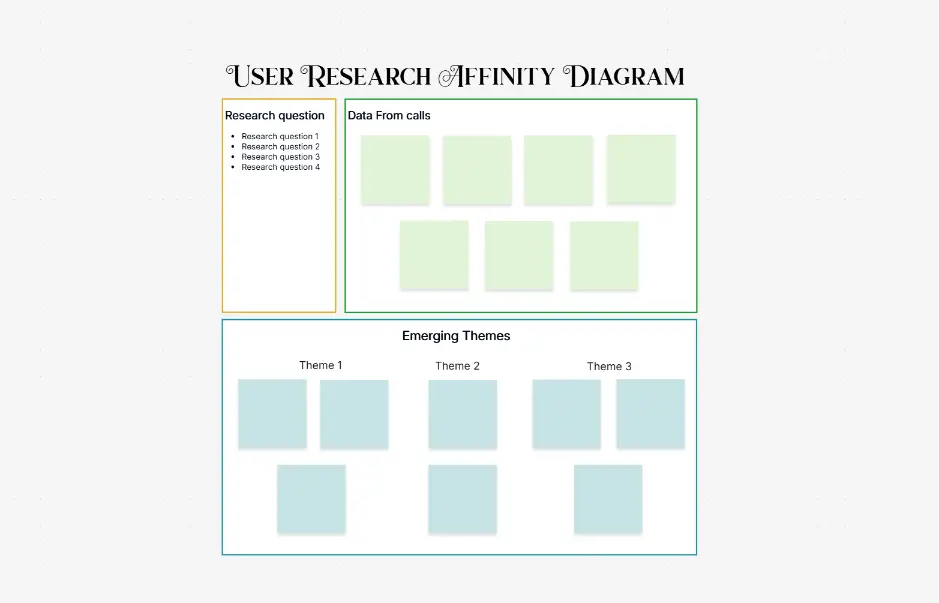
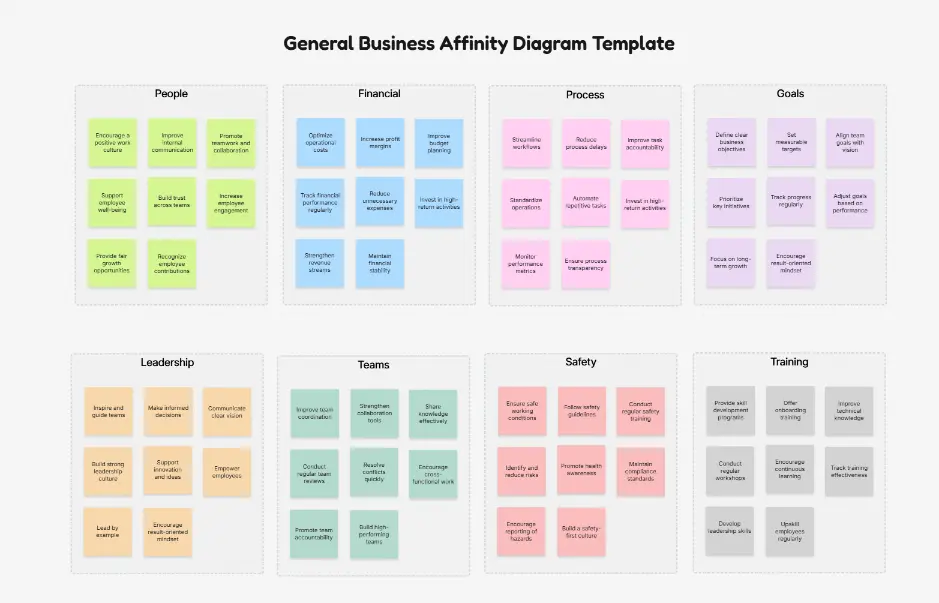
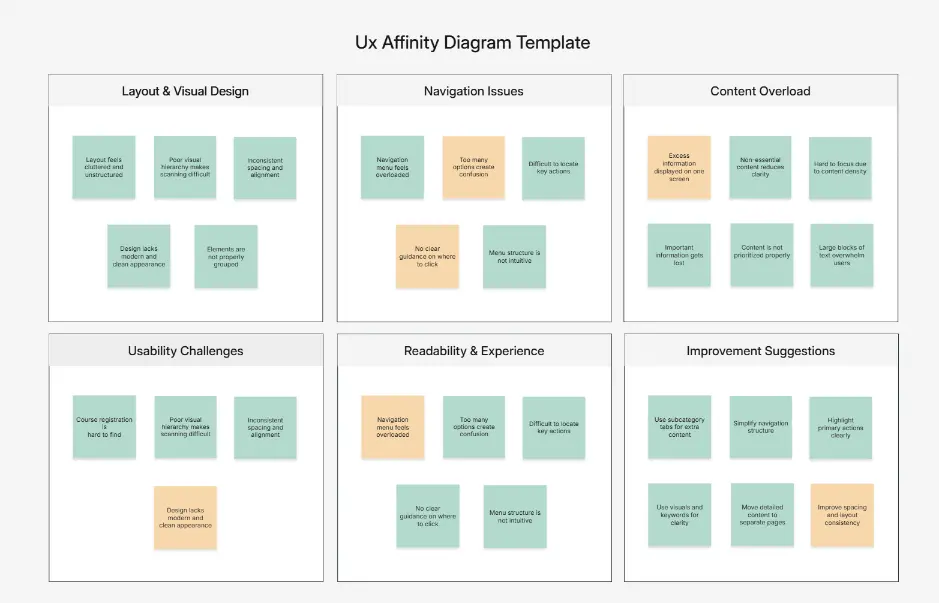
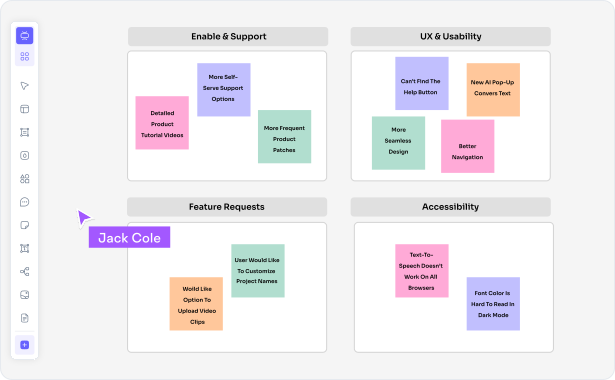
KJ method templates — pre-built diagrams for UX research, product management, Six Sigma, and design thinking
Multi-format export — PNG for presentations, SVG for editing, Visio for enterprise integration