AI Root Cause Analysis
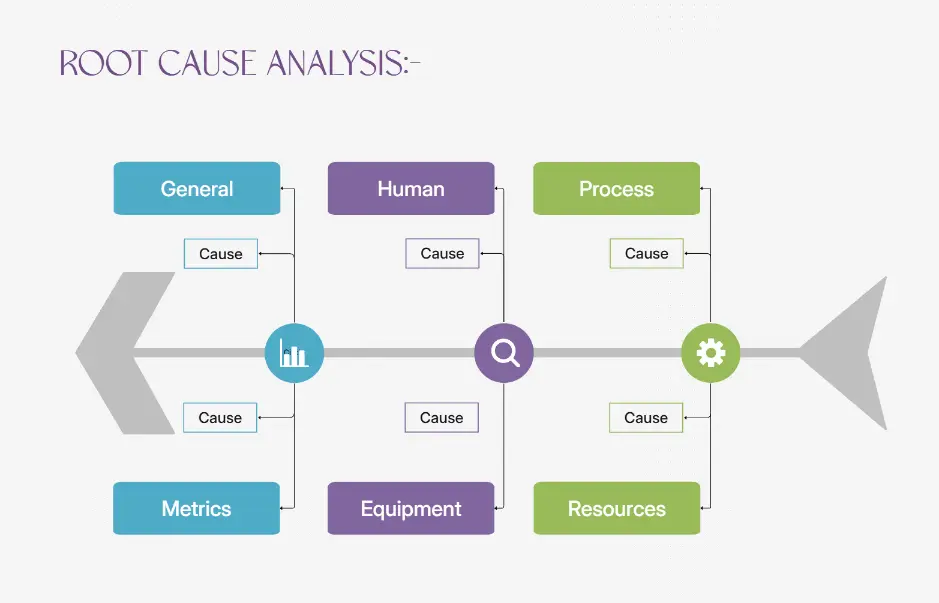
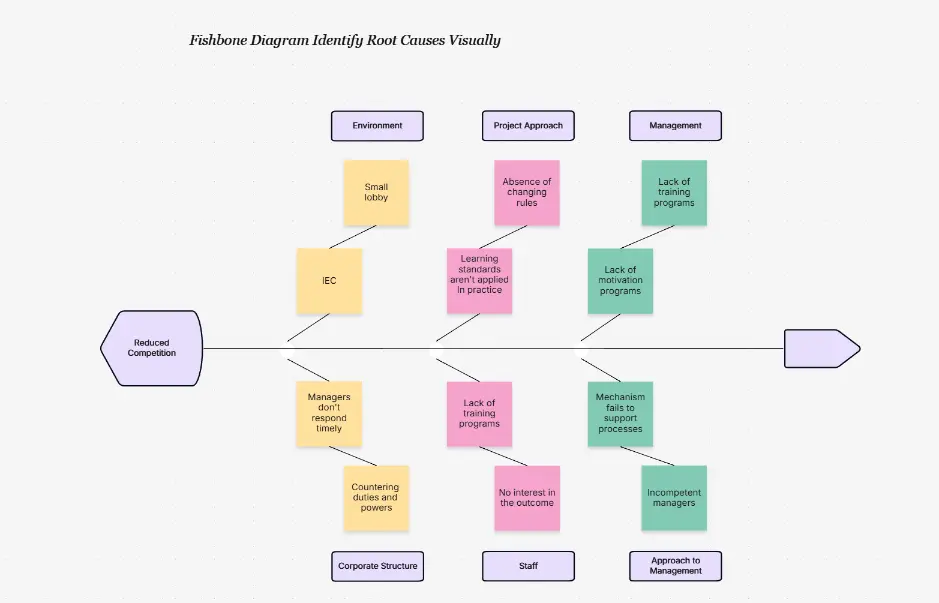
Cause & Effect Diagram Maker — AI Root Cause Analysis Tool
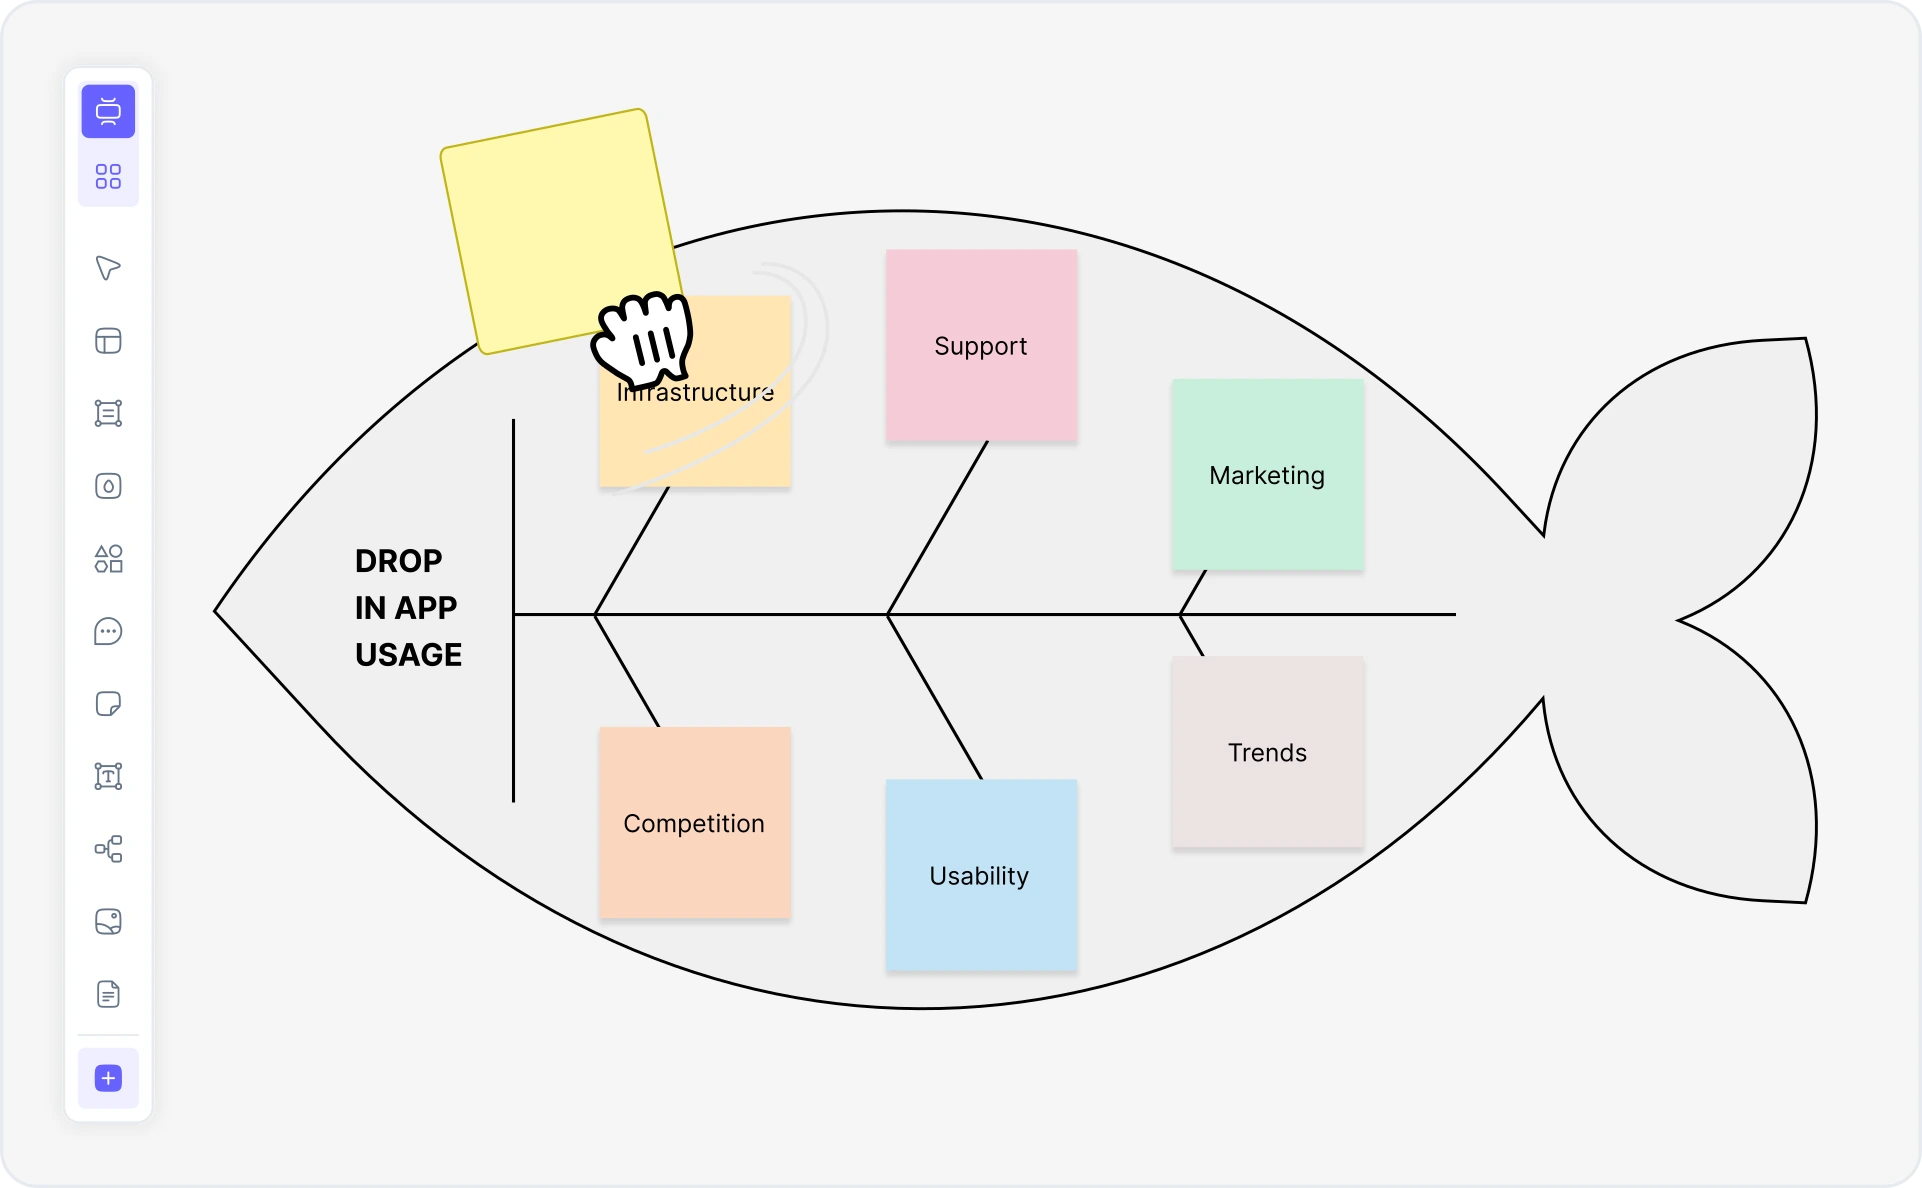
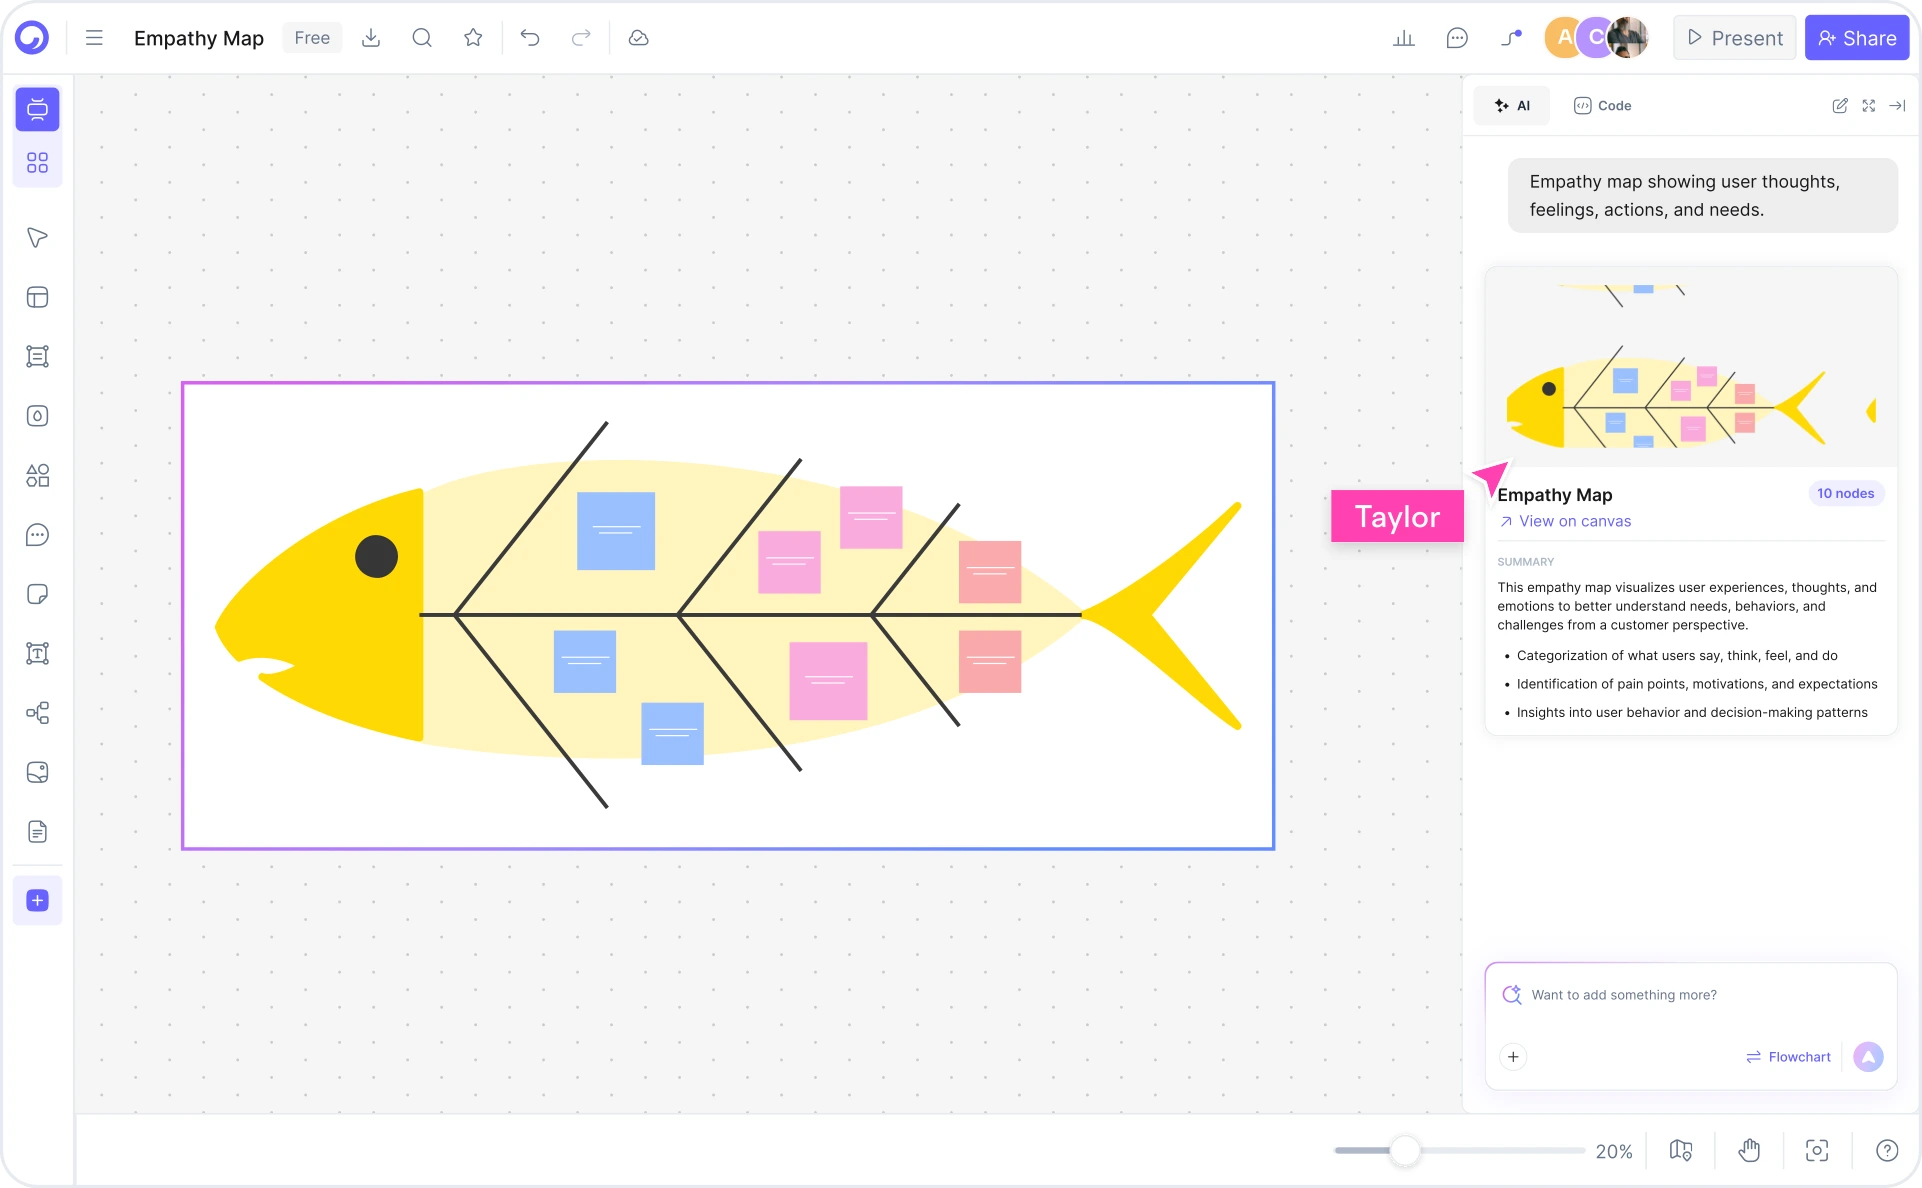
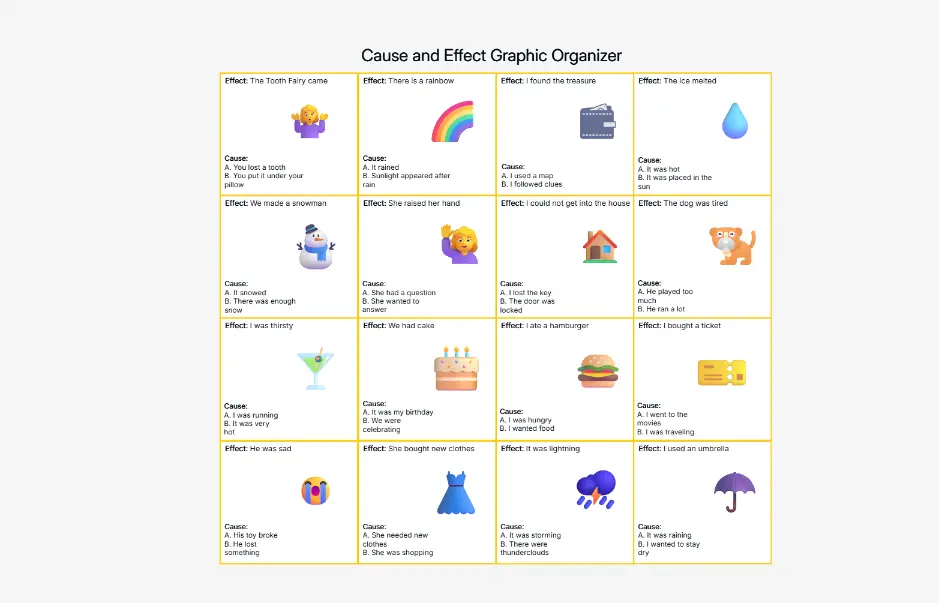
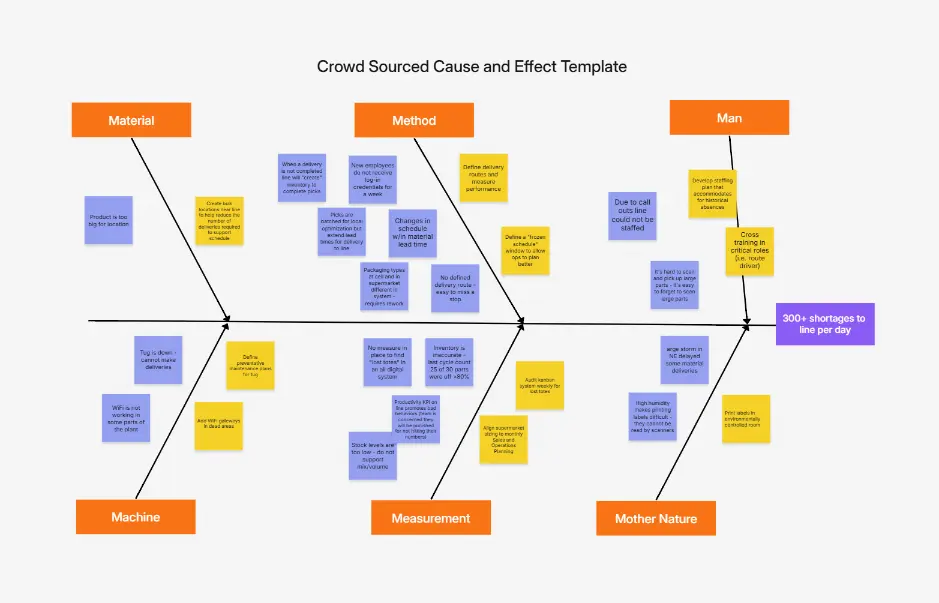
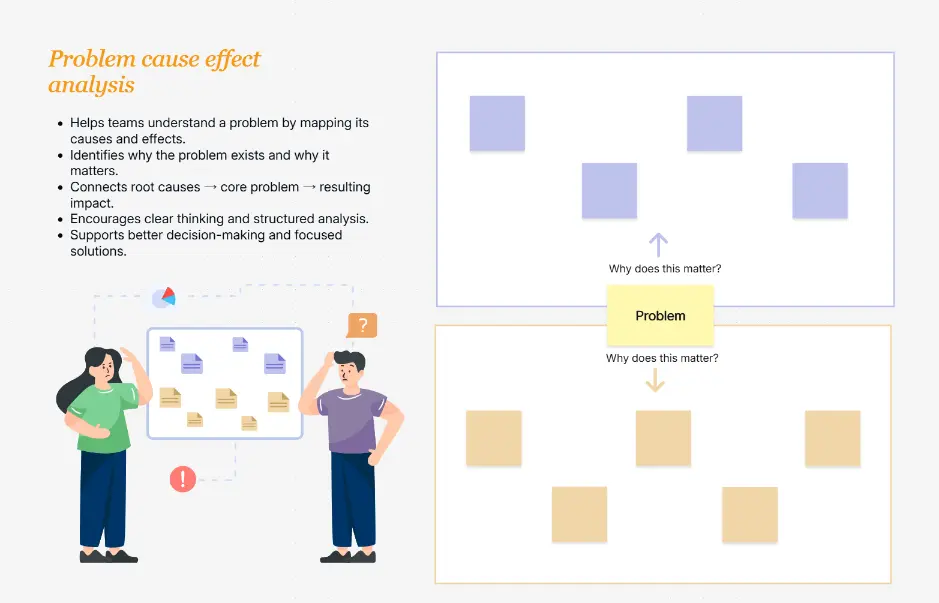
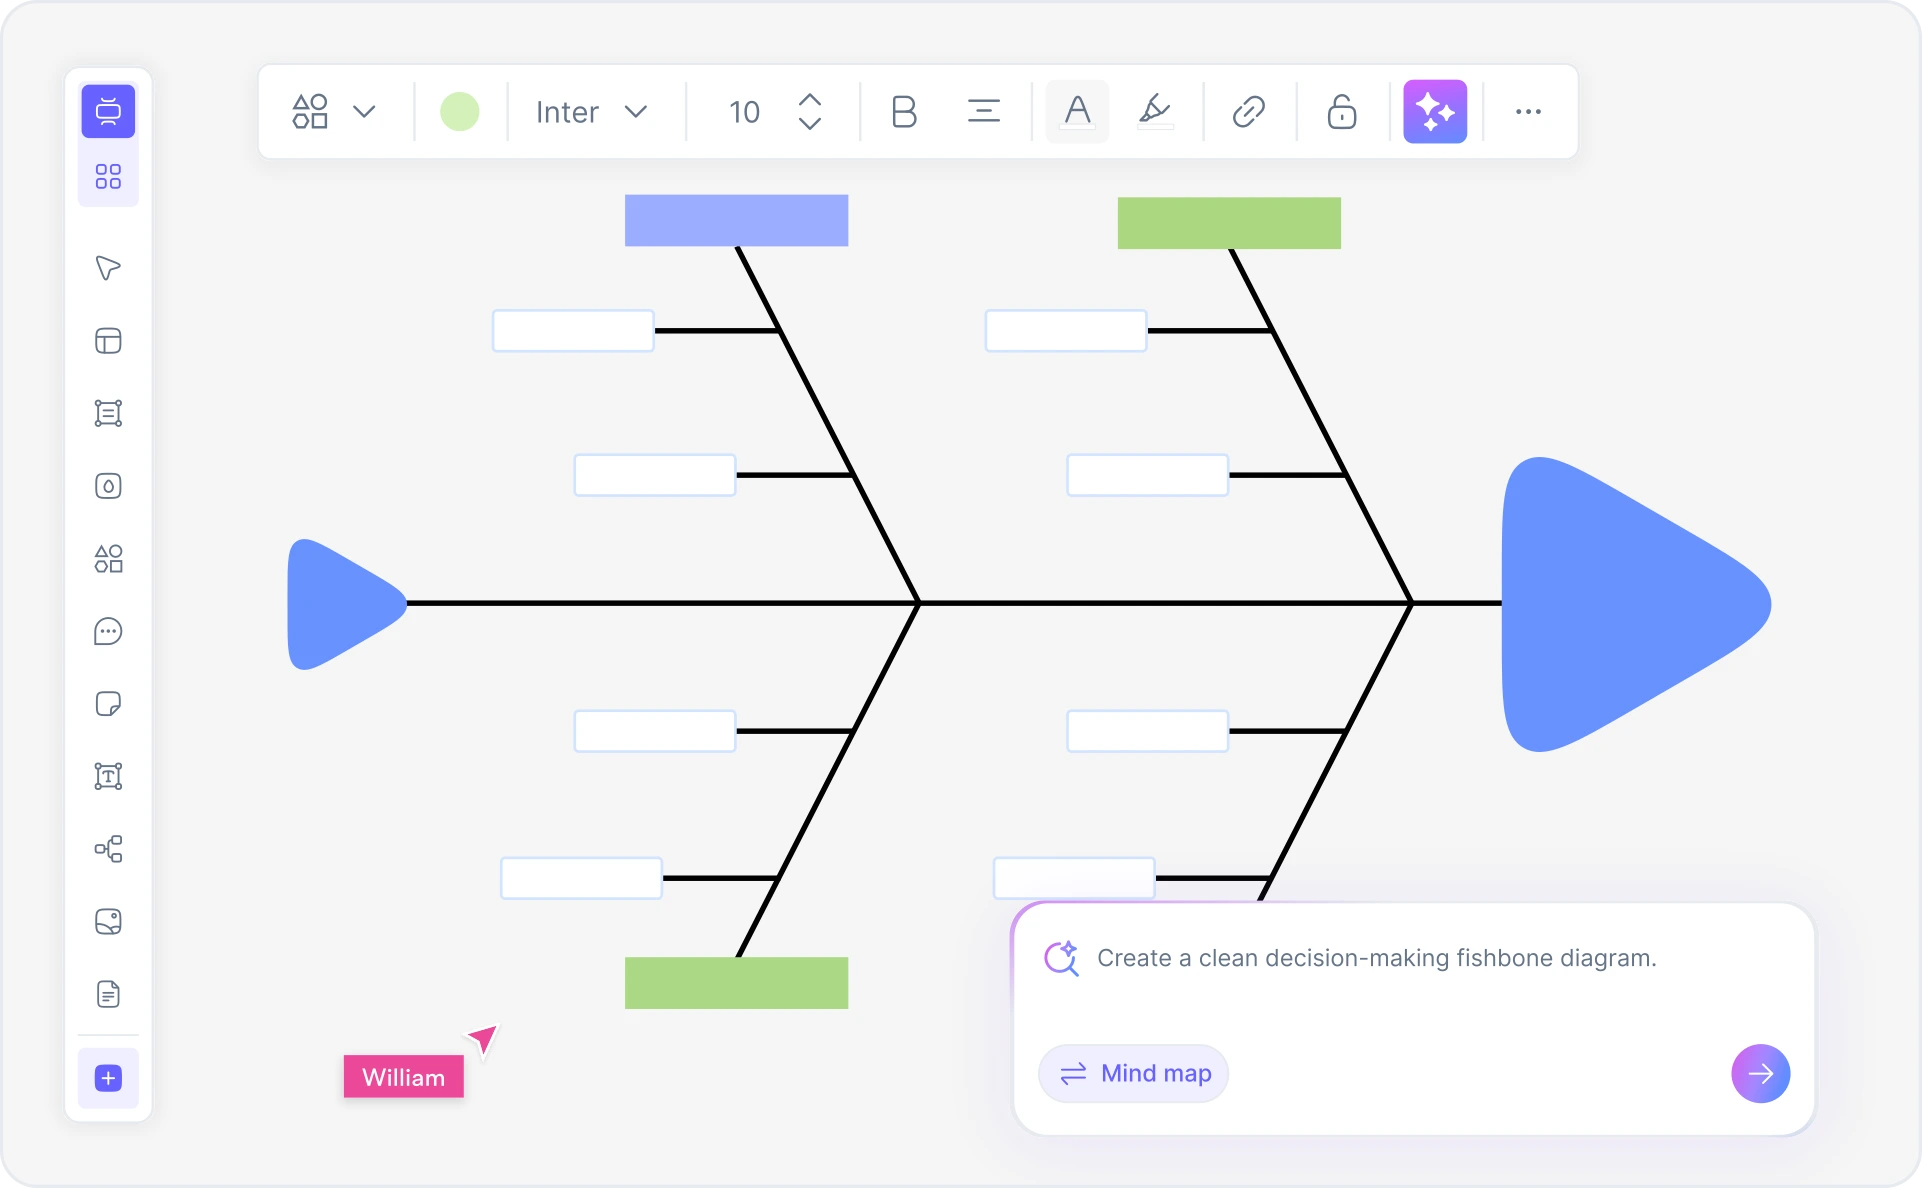
Describe your problem and Cloudairy's AI instantly generates a complete cause-and-effect diagram with root causes, contributing factors, and causal chains — in seconds. Export to Visio, draw.io, PDF, or PowerPoint. No manual drawing, no complex templates, no methodology training required.
AI prompt-to-diagram — describe your problem and get a complete cause-and-effect diagram in seconds
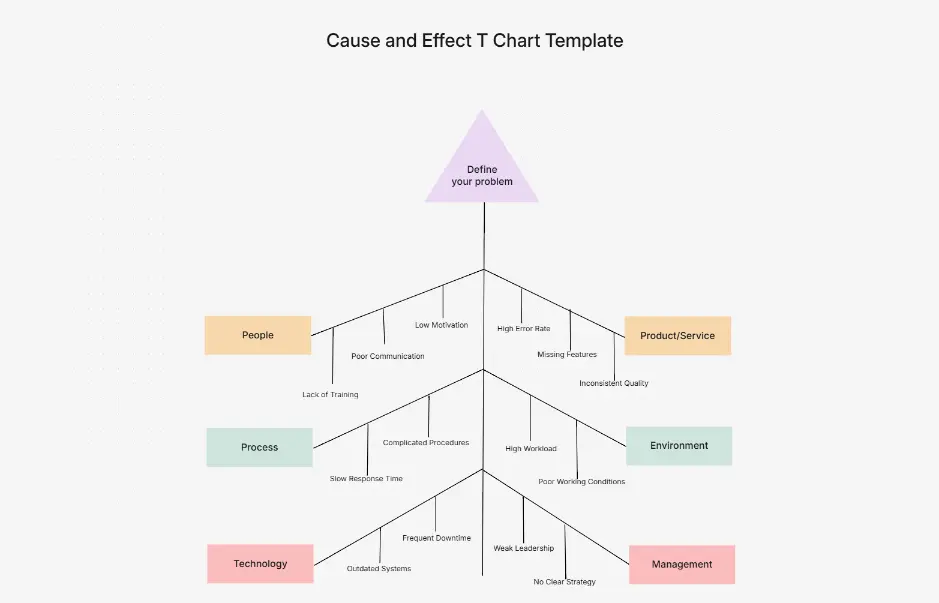
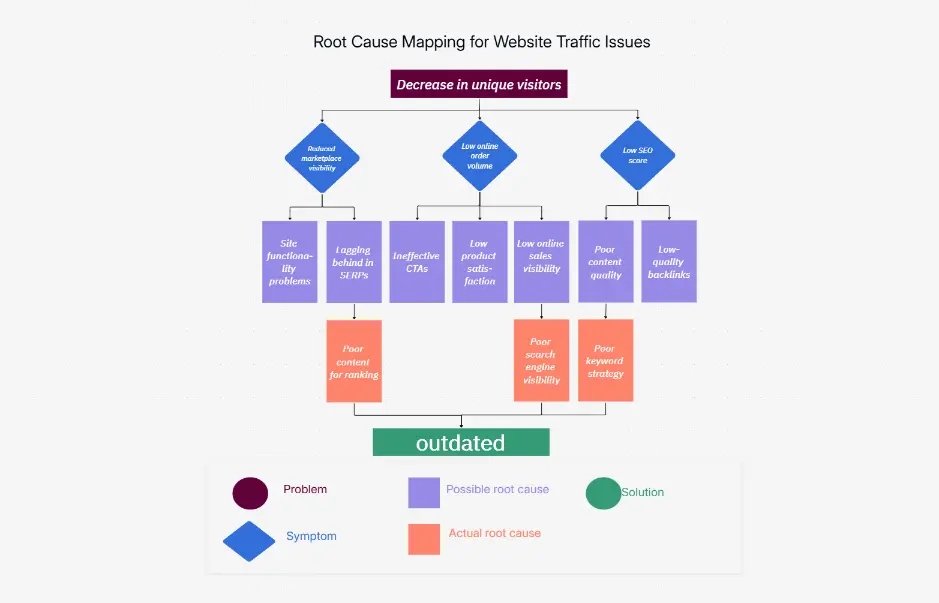
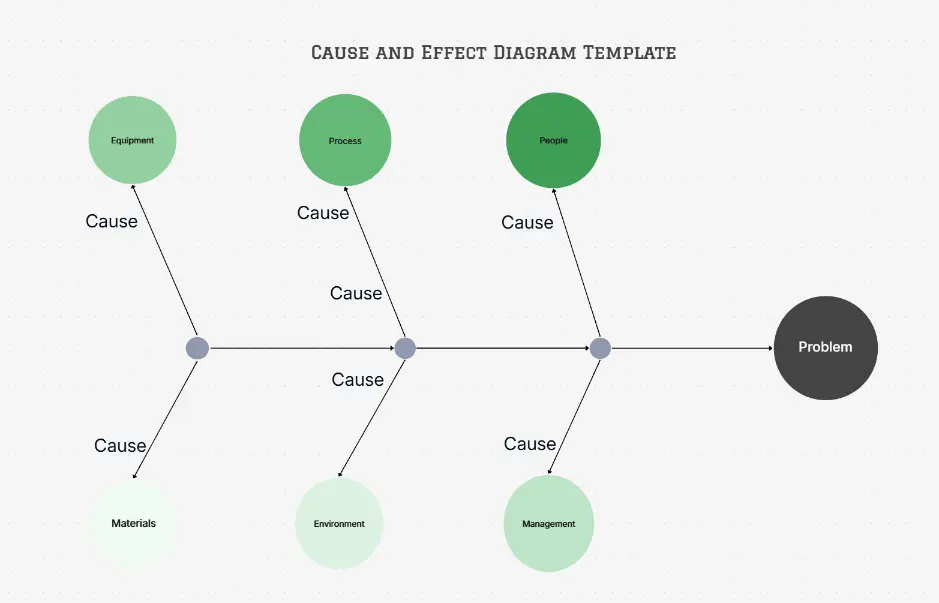
Root cause analysis — 5 Whys integration, fishbone methodology, and causal chain visualization
Multi-format export — Visio VSD, draw.io XML, PDF, and PowerPoint