AI Pictograph Maker
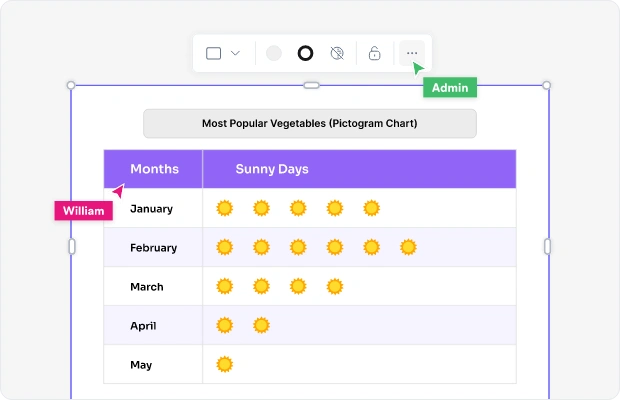
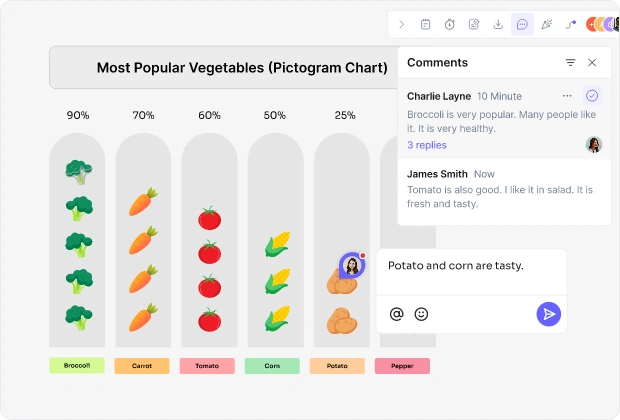
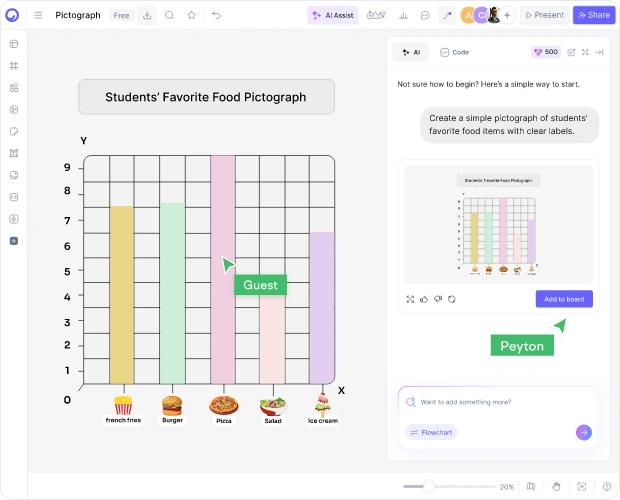
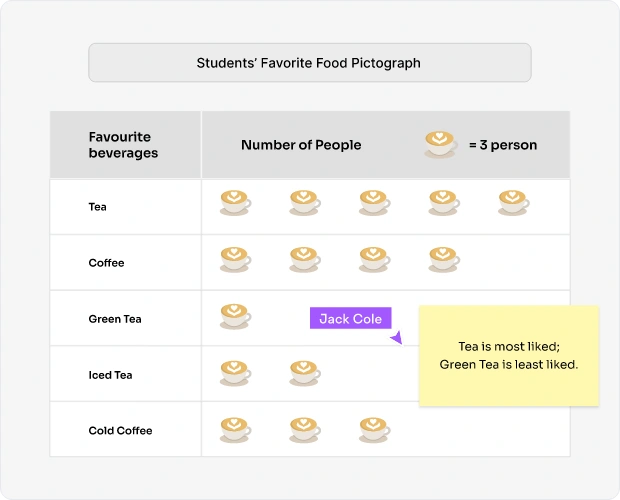
A pictograph maker helps you visually represent data and information using simple symbols without manual effort. By using AI, you can convert basic text or numbers into clear, professional pictographs that show values, comparisons, and patterns in an easy-to-understand way.

Professionally crafted pictograph templates for quick customization
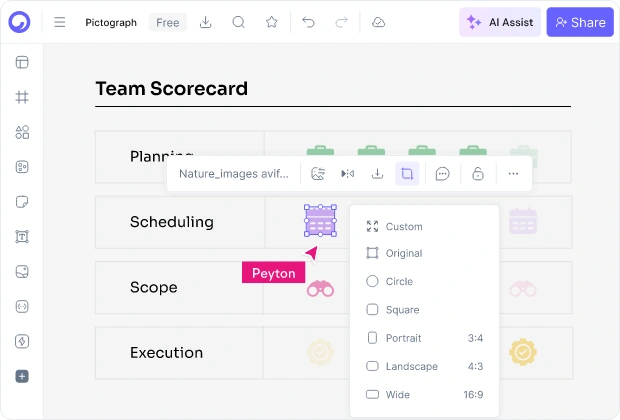
An AI pictograph maker for clear and simple data visualization
Add symbols, values, and labels directly to your pictograph charts