AI Sankey Diagram Generator
AI Sankey Diagram Generator — Visualize Data Flows Instantly
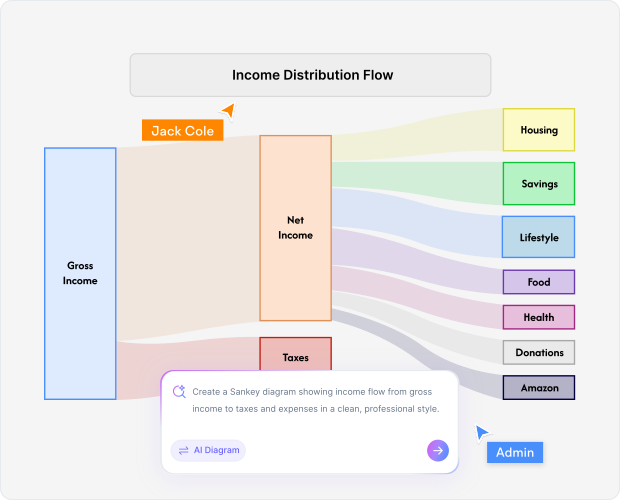
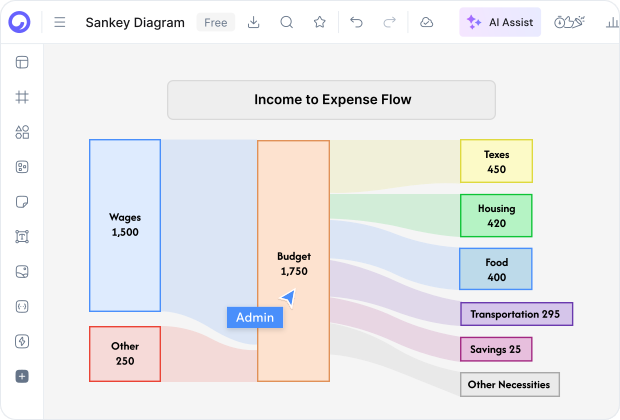
Transform complex data flows into clear, proportional Sankey diagrams in seconds. Cloudairy's AI Sankey diagram generator takes your written descriptions of energy, cost, or material flows and automatically creates professional diagrams where arrow widths represent actual volumes. Whether you're mapping energy consumption, budget allocation, or supply chain flows, our AI creates accurate visualizations instantly.
Proportional arrow widths that accurately reflect your flow volumes
Works for energy audits, cost allocation, material flows, and budget analysis
Export as PNG, SVG, or PDF for reports, presentations, and documentation