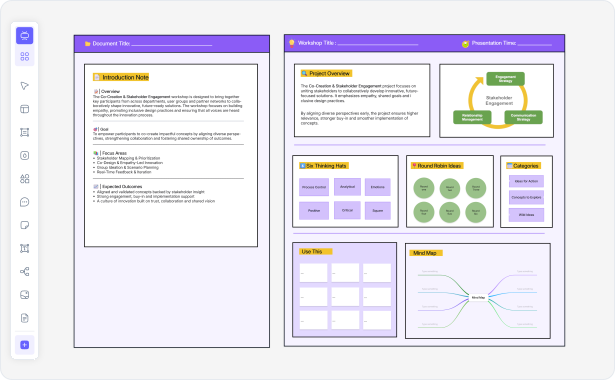
Stakeholder Mapping Tool
Stakeholder Map Maker — AI-Powered
Create stakeholder maps and power-interest grids instantly with AI. Analyze influence, classify engagement, export PNG/SVG/Visio. Free to start.
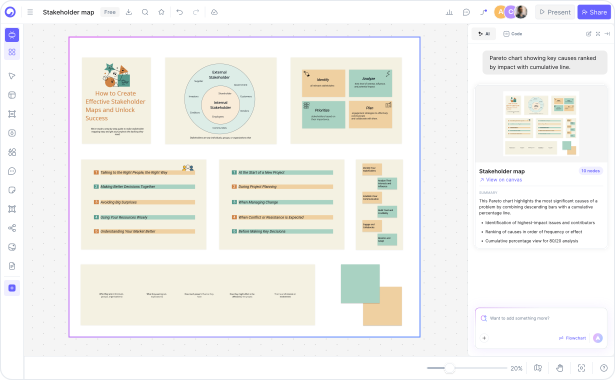
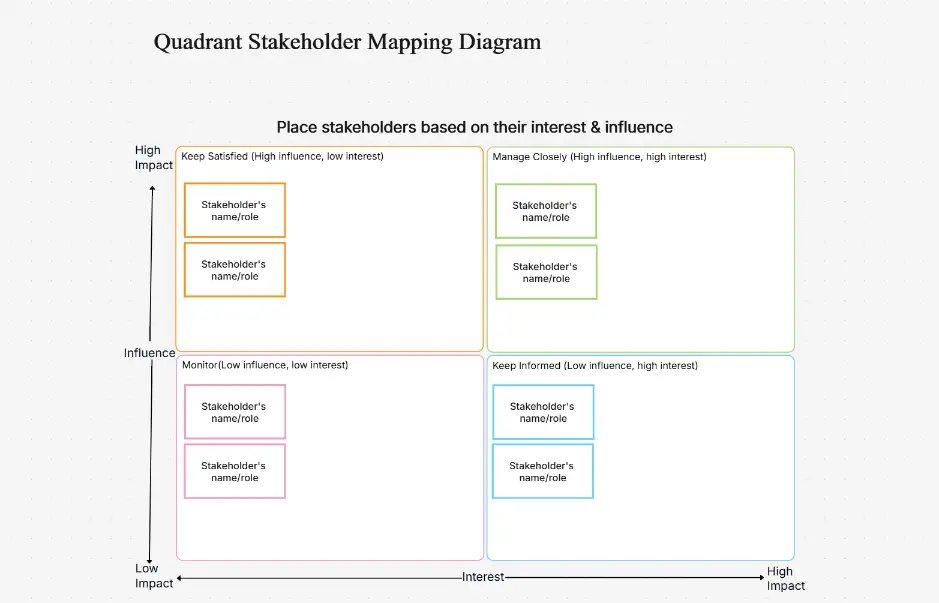
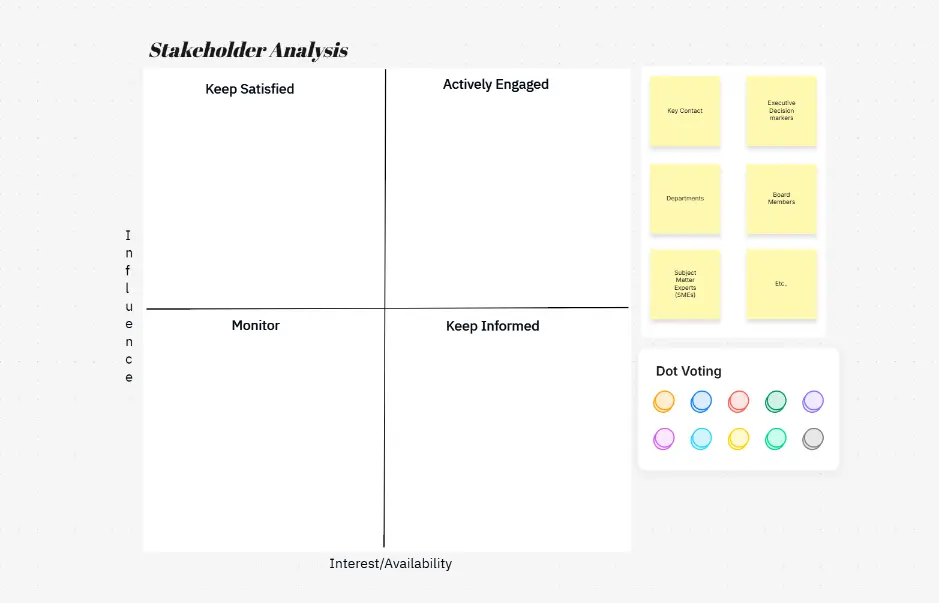
AI prompt-to-map — describe your stakeholders and generate power-interest grids in seconds
Auto-classification — AI positions stakeholders by power and interest automatically
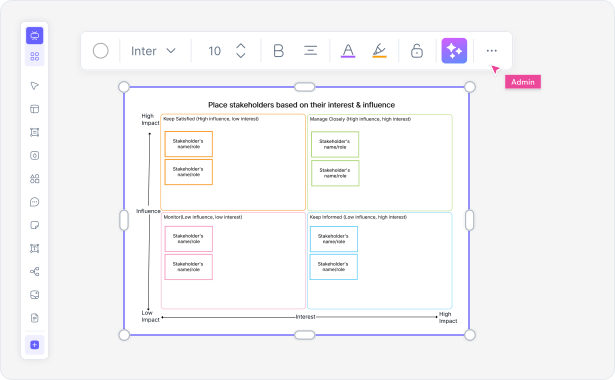
Export to Visio, PNG, SVG — enterprise-ready formats for presentations and documentation