AI Supply and Demand Graph Maker
AI Supply and Demand Graph Maker — Create Economic Graphs Instantly
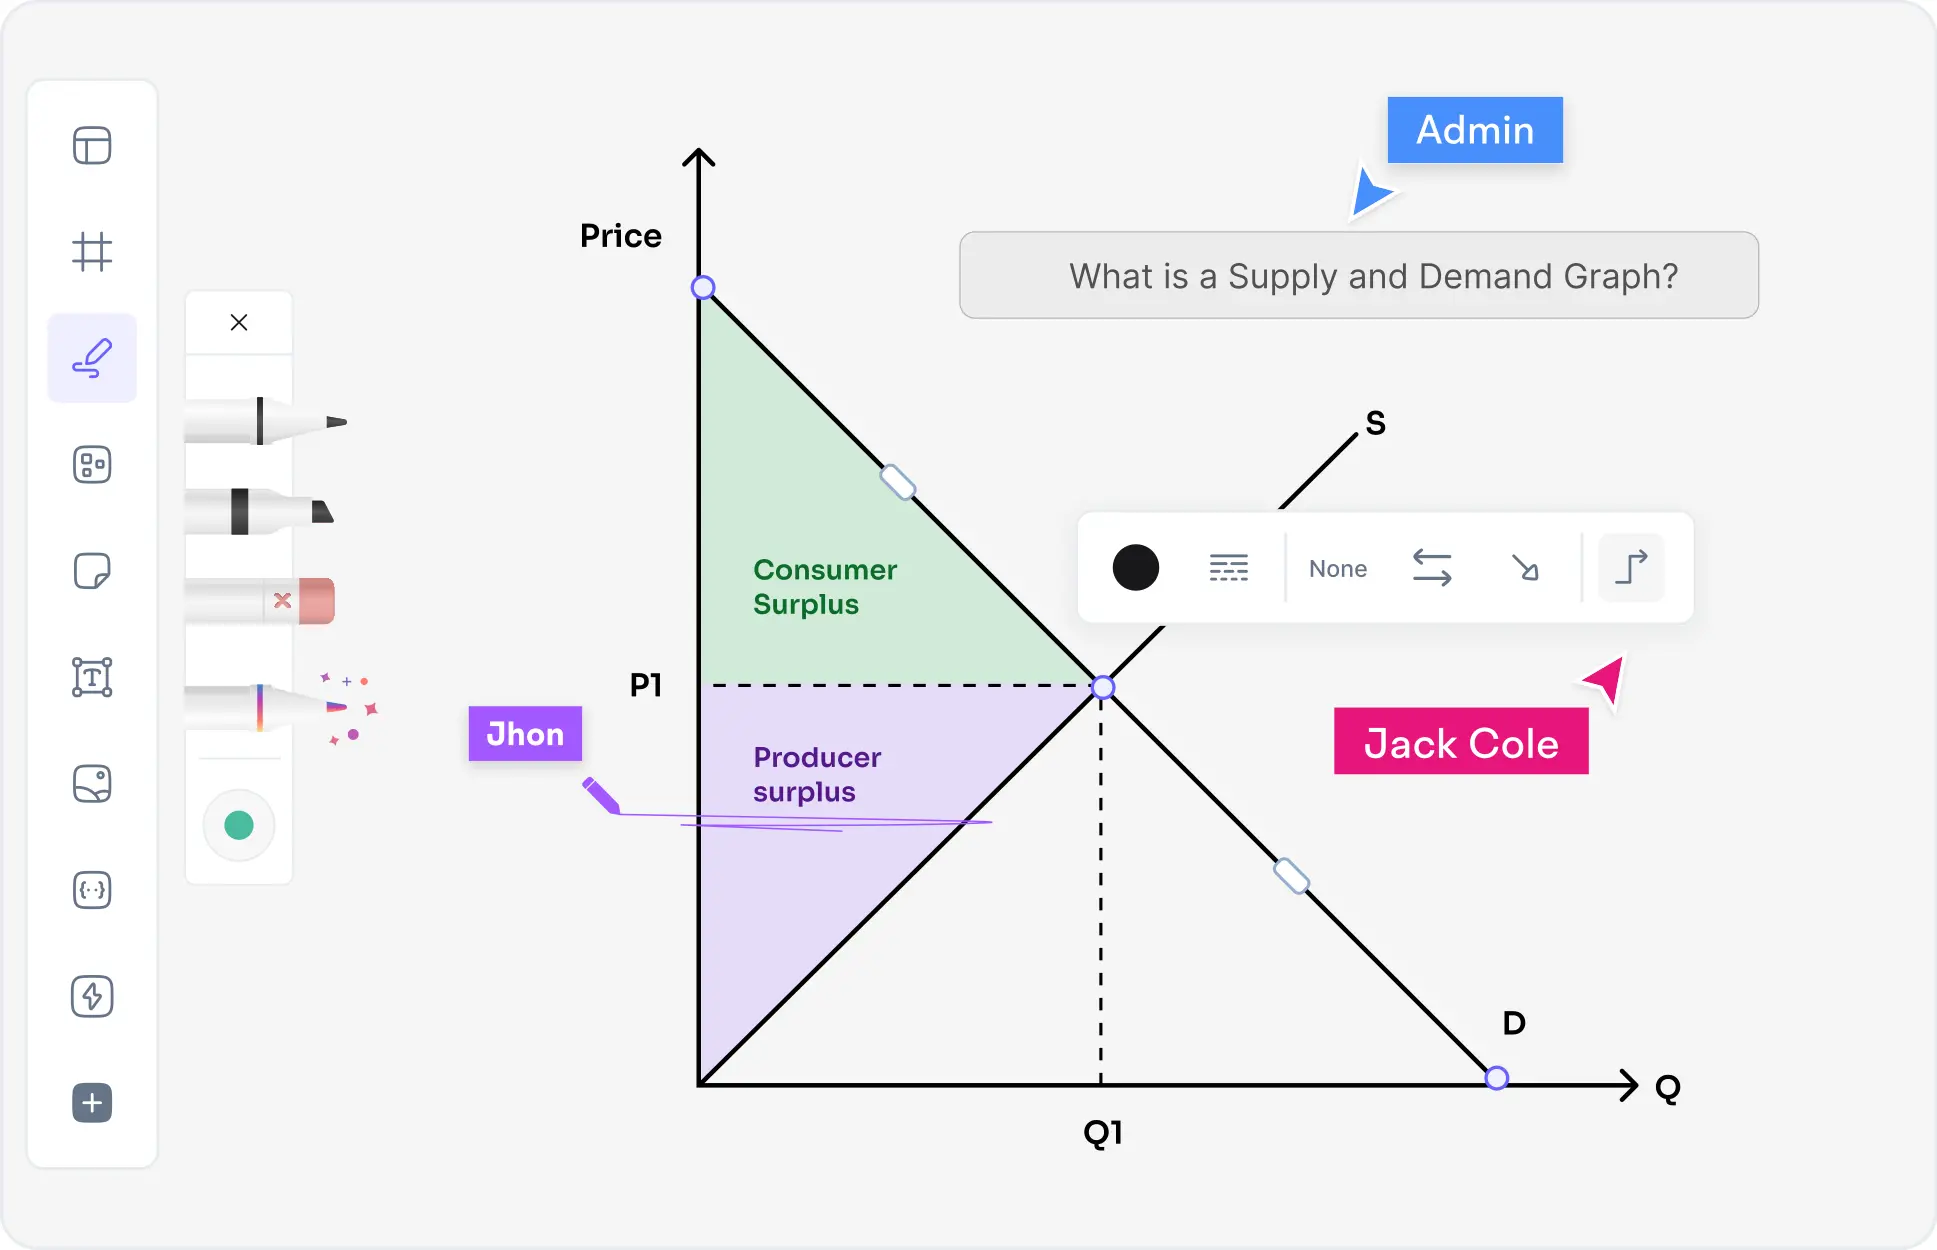
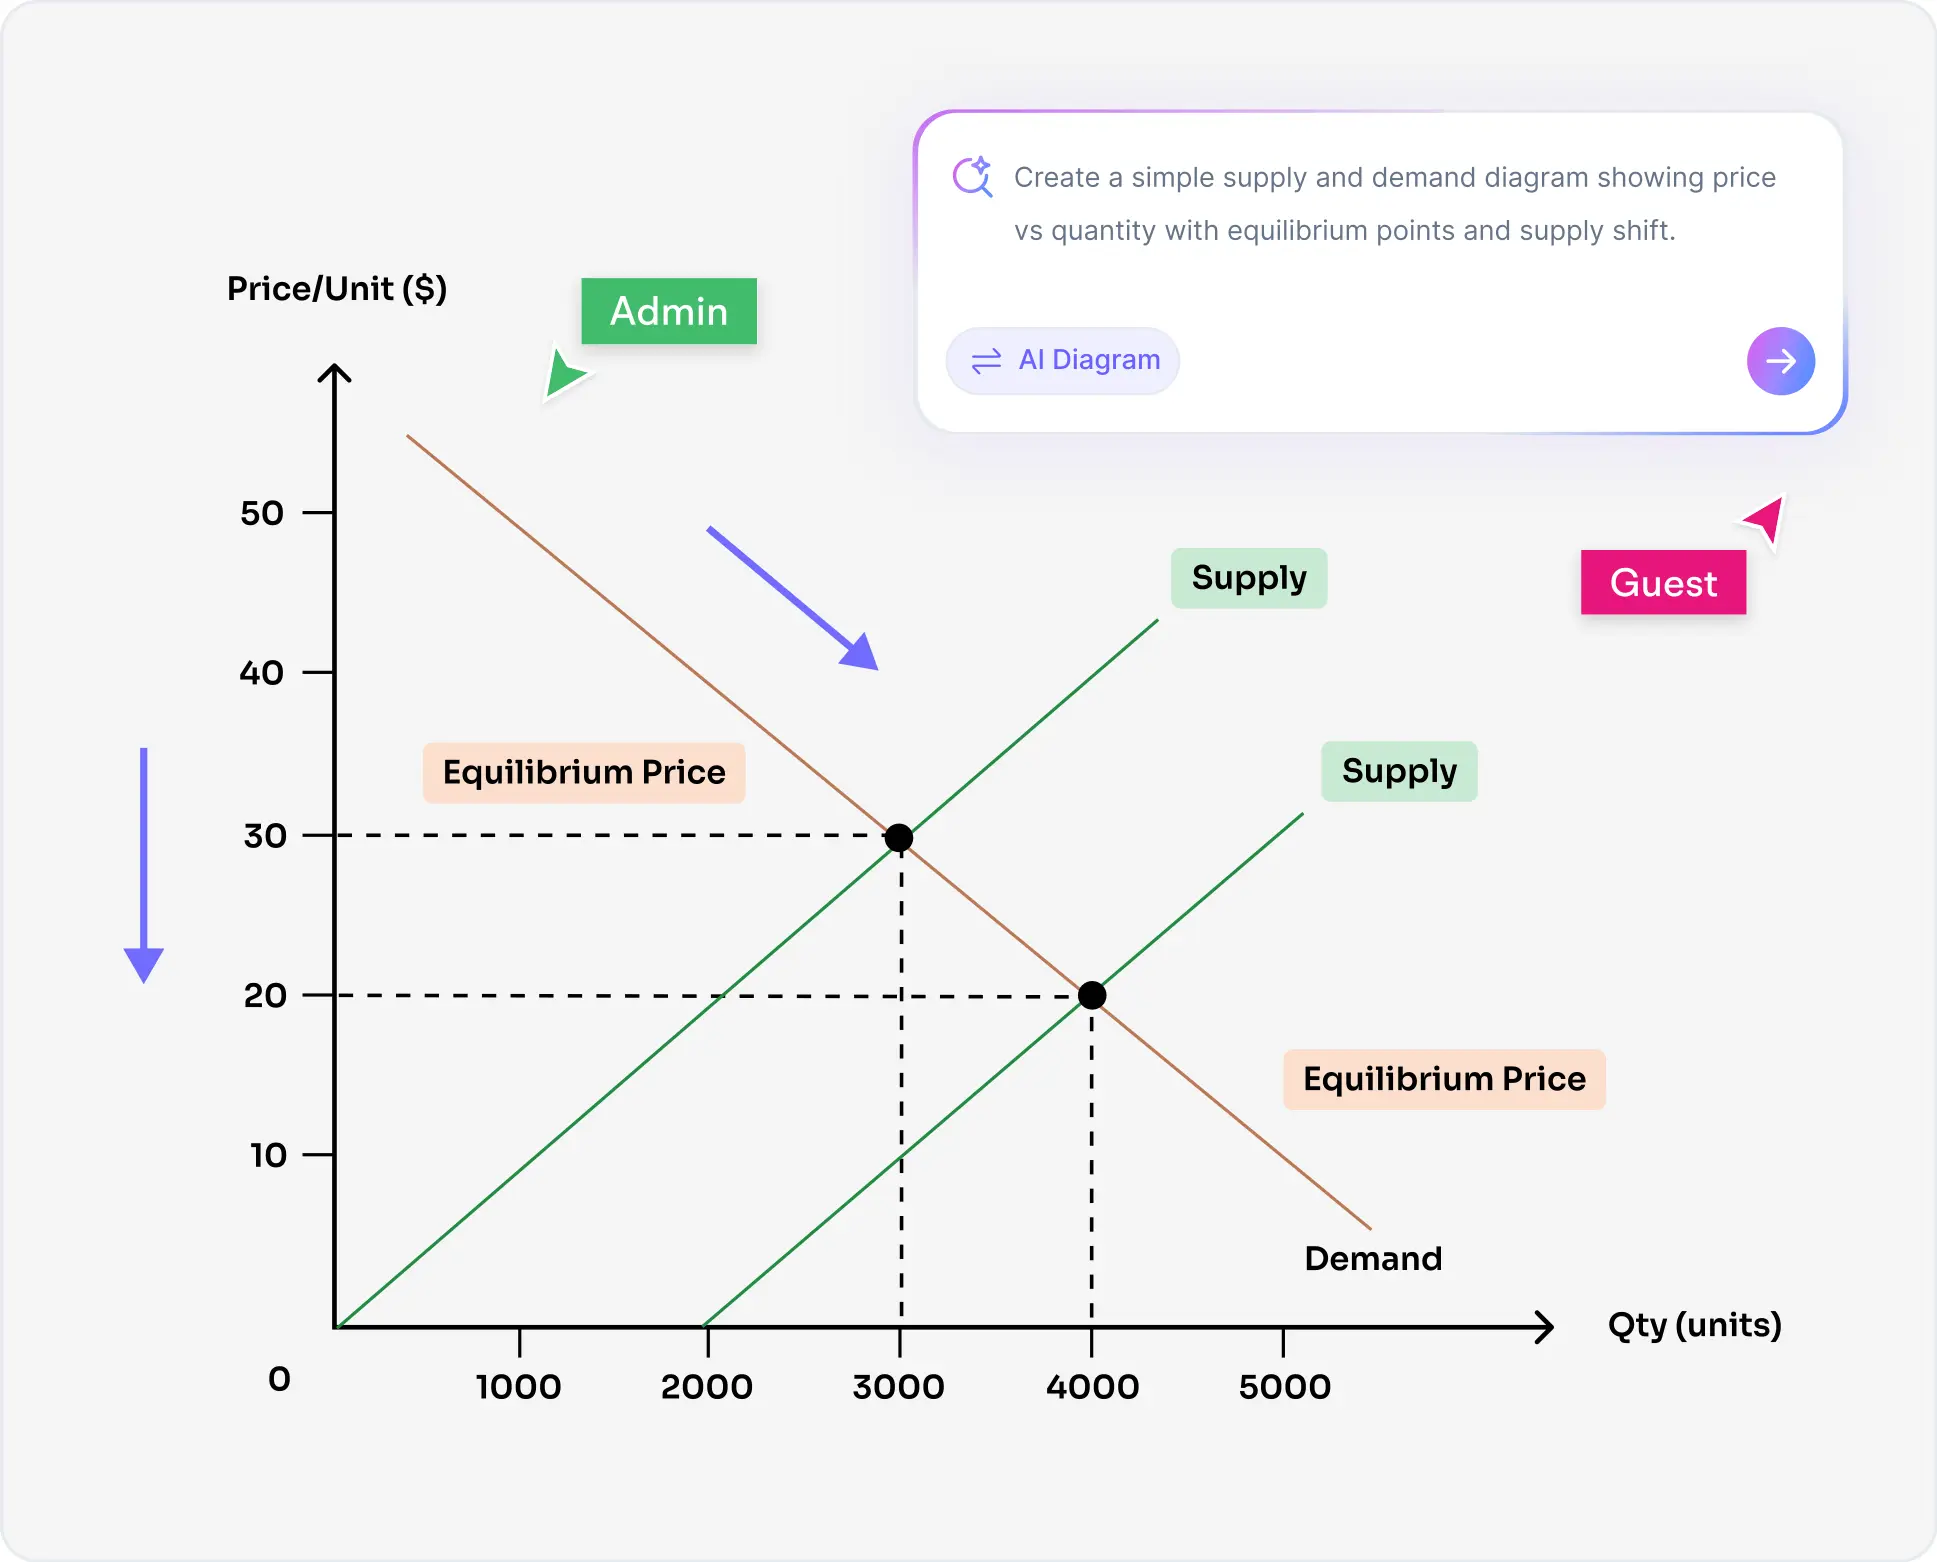
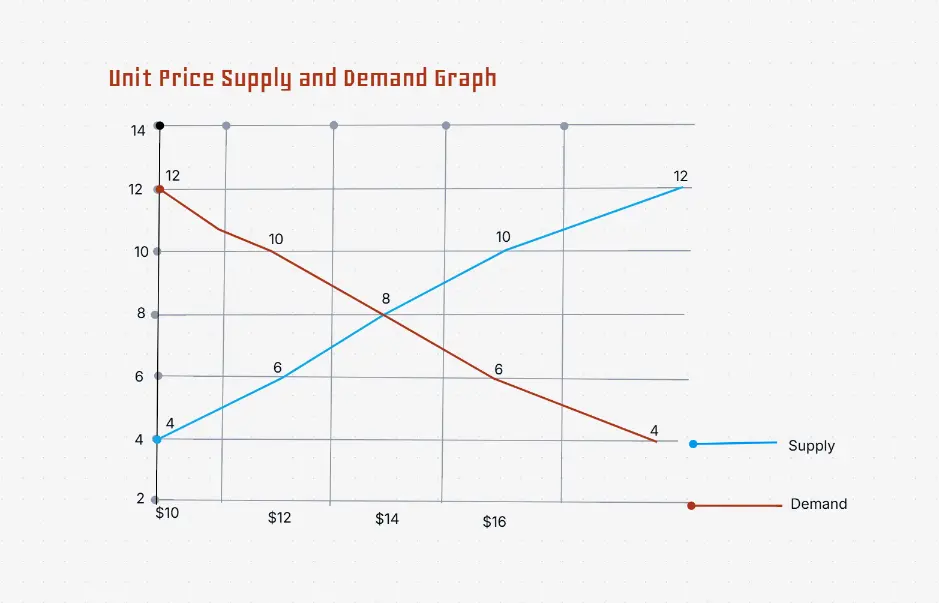
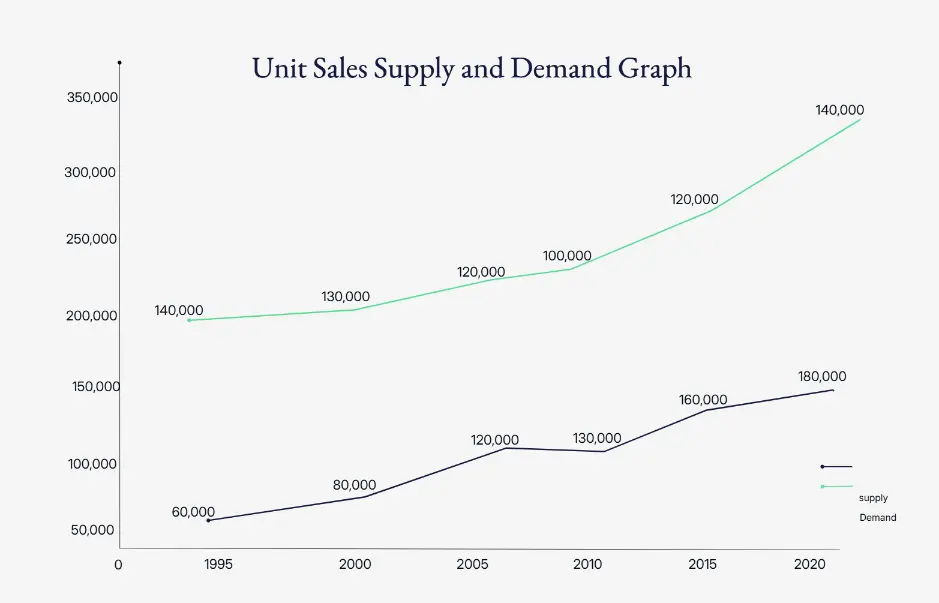
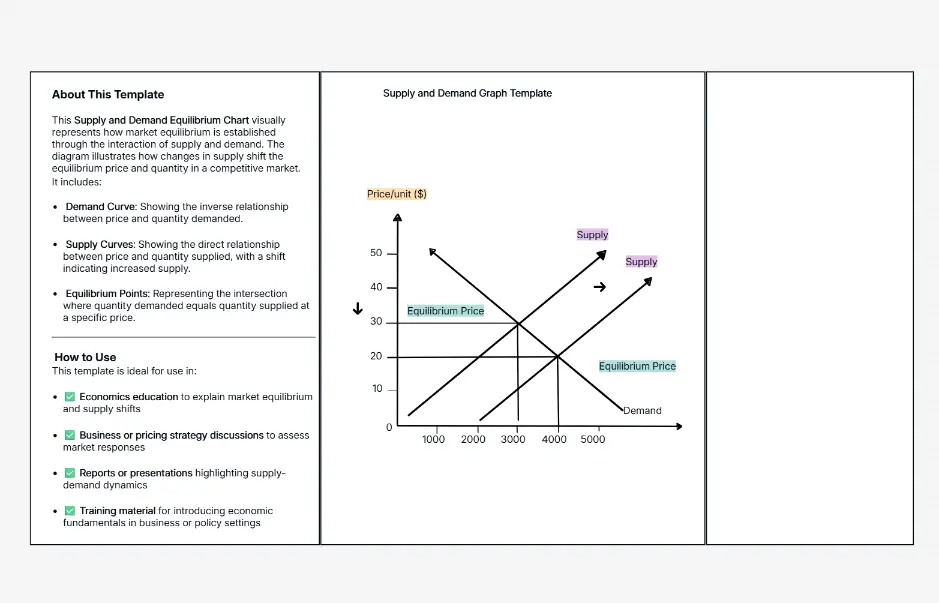
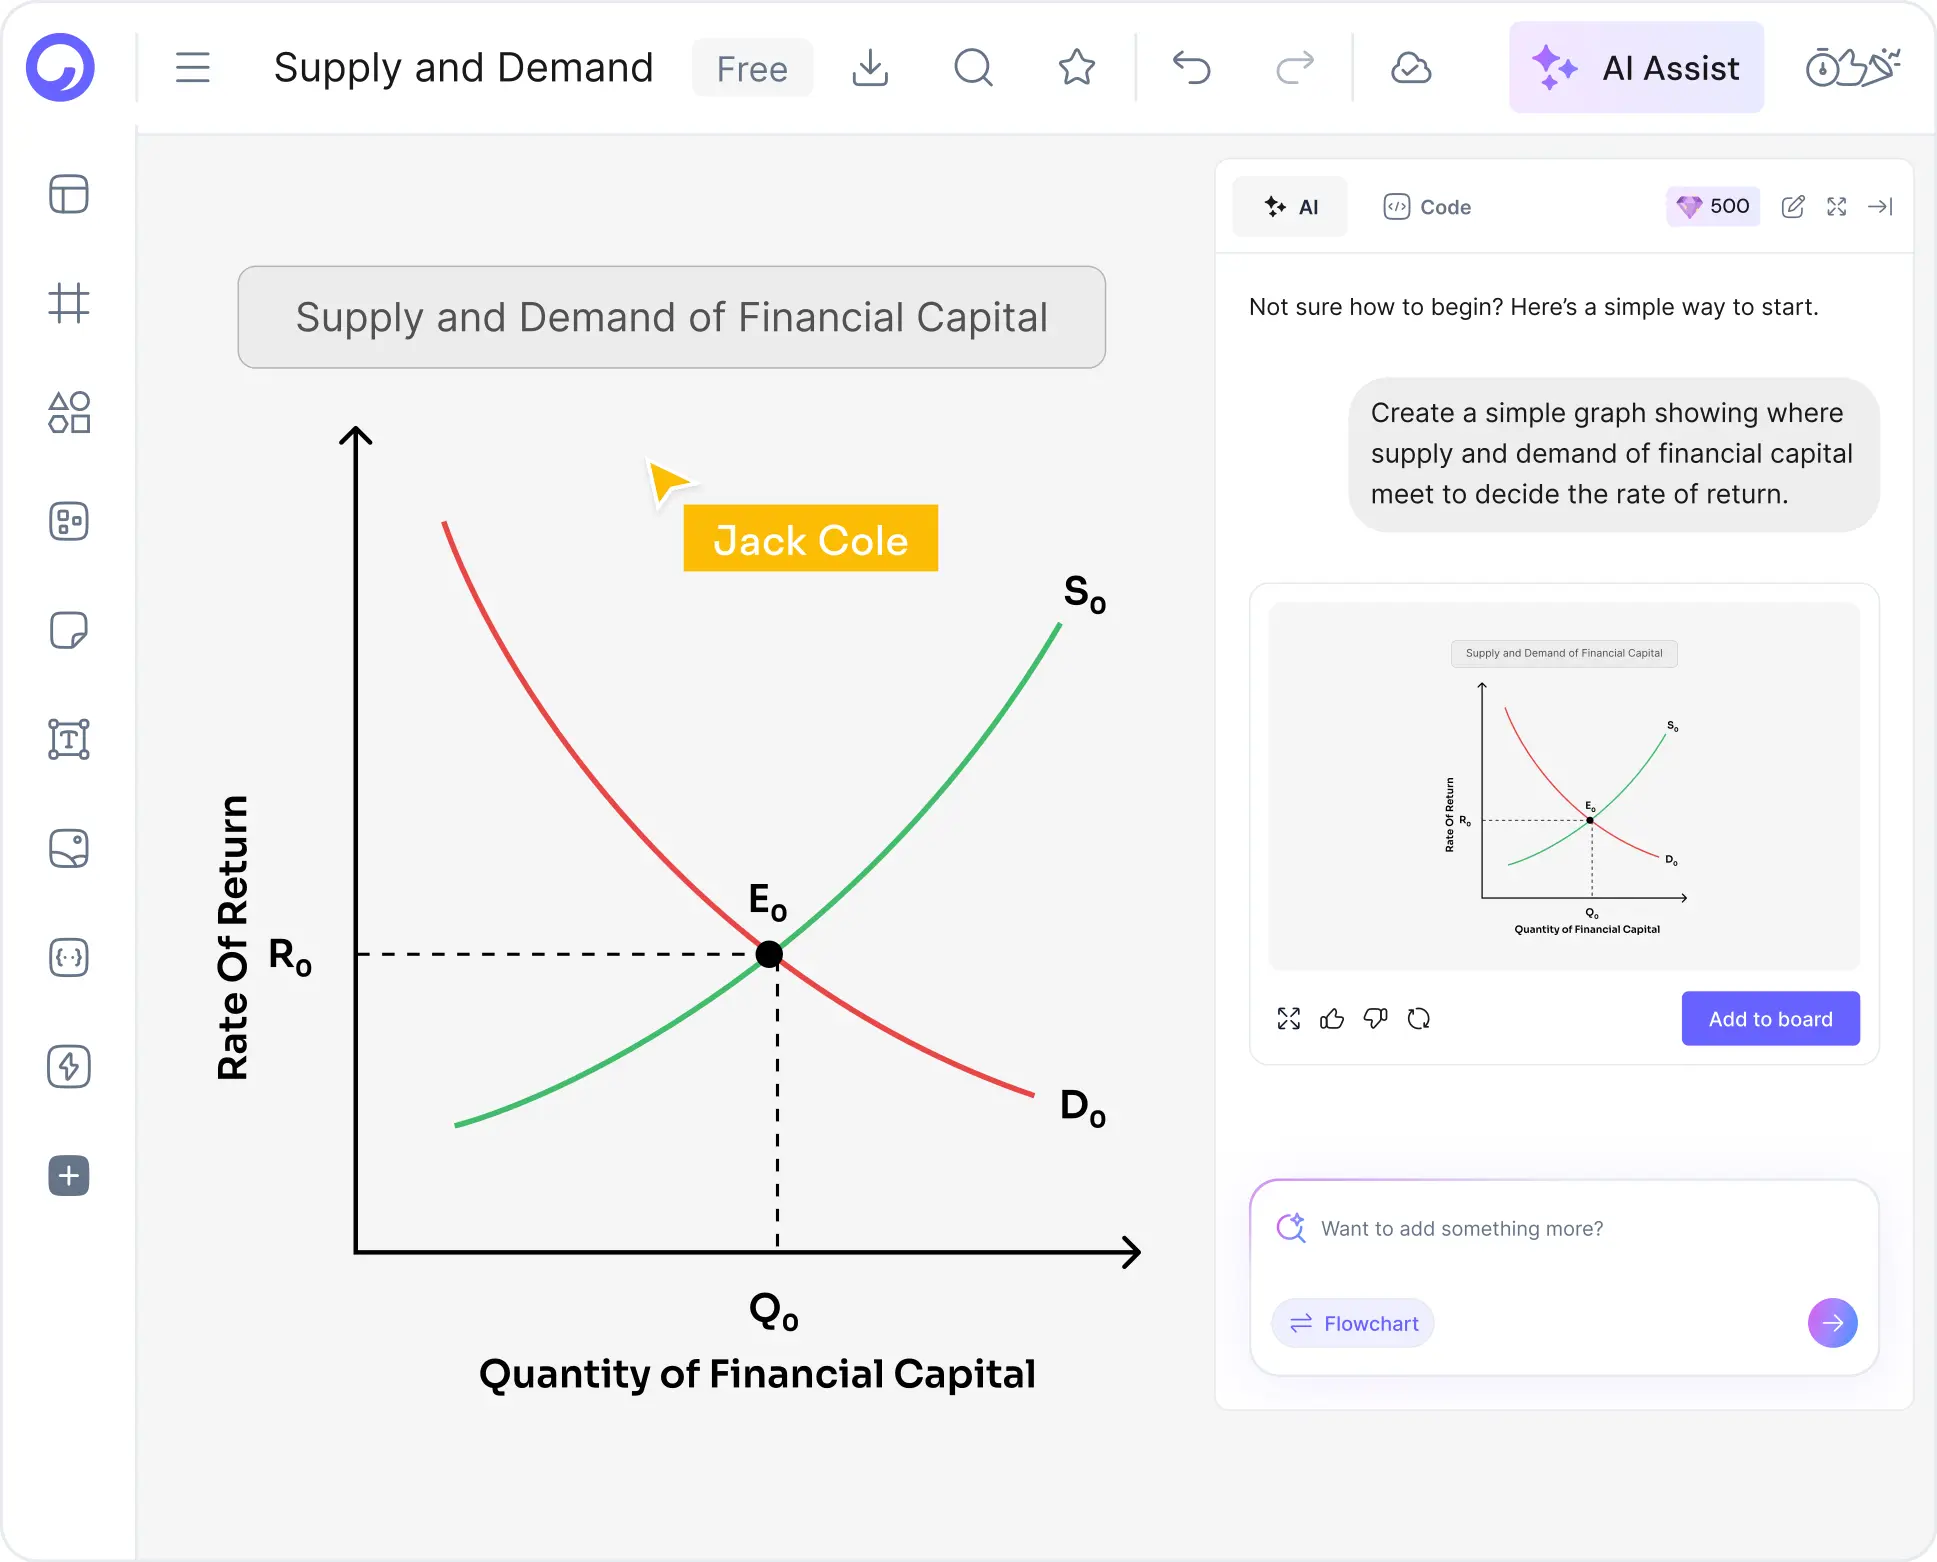
Transform complex market scenarios into clear, professional supply and demand graphs in seconds. Cloudairy's AI supply and demand graph maker takes your text descriptions and automatically generates accurate graphs with supply curves, demand curves, and equilibrium points. Whether you're studying economics, analyzing markets, or teaching pricing concepts, our AI builds the visualization for you.
Generate professional supply and demand graphs from text — just describe your market scenario
AI plots supply curves, demand curves, and equilibrium points automatically
Export graphs in multiple formats for teaching, analysis, and presentations