What is a Tree Diagram?


AI Workspace for Diagrams & Collaboration
Get your team started in minutes
Sign up with your work email for seamless collaboration.
In this guide, you will learn:
Tree diagrams help people visualize relationships, decisions, and hierarchical structures in a clear and logical way.
This guide explains what is a tree diagram, why it matters, and how it is used across education, business, science, and daily problem-solving.
Whether you are organizing data, analyzing outcomes, or explaining complex ideas, understanding tree diagrams makes structured thinking easier.
This guide covers the definition, parts, types, benefits, creation steps, practical uses, and examples in simple, easy-to-understand language.
A tree diagram is a visual representation that displays information in a branching structure, starting from a single root and spreading into connected nodes and branches.
It shows relationships, sequences, or decisions step by step. A diagram of tree helps break complex ideas into smaller parts, making patterns, outcomes, and hierarchies easier to understand.
A tree diagram is made up of clearly defined parts that work together to form a logical structure. These parts of a tree diagram help users understand flow, hierarchy, and outcomes in a structured and visual way.
1. Root Nodes (Main Idea/Start)
The root node represents the starting point of the diagram tree. It contains the main idea, question, or problem from which the entire tree structure diagram begins.
2. Nodes (Decision Points/Events, Often Circles/Squares)
Nodes represent decisions, events, or categories. In many tree chart or branching diagram designs, nodes are shown as circles or squares for clarity.
3. Branches (Lines Showing Relationships/Flow)
Branches connect nodes and show the flow or relationship between them. A branching tree diagram clearly illustrates how one idea leads to multiple possibilities.
4. Leaf Nodes (Final Outcomes/Endpoints That Don’t Branch Further)
Leaf nodes are the endpoints of the diagram of tree. They represent final outcomes or conclusions where no further branches exist.
Different tree kinds of diagram are used based on purpose and context. Each type follows the same core structure but solves different problems.
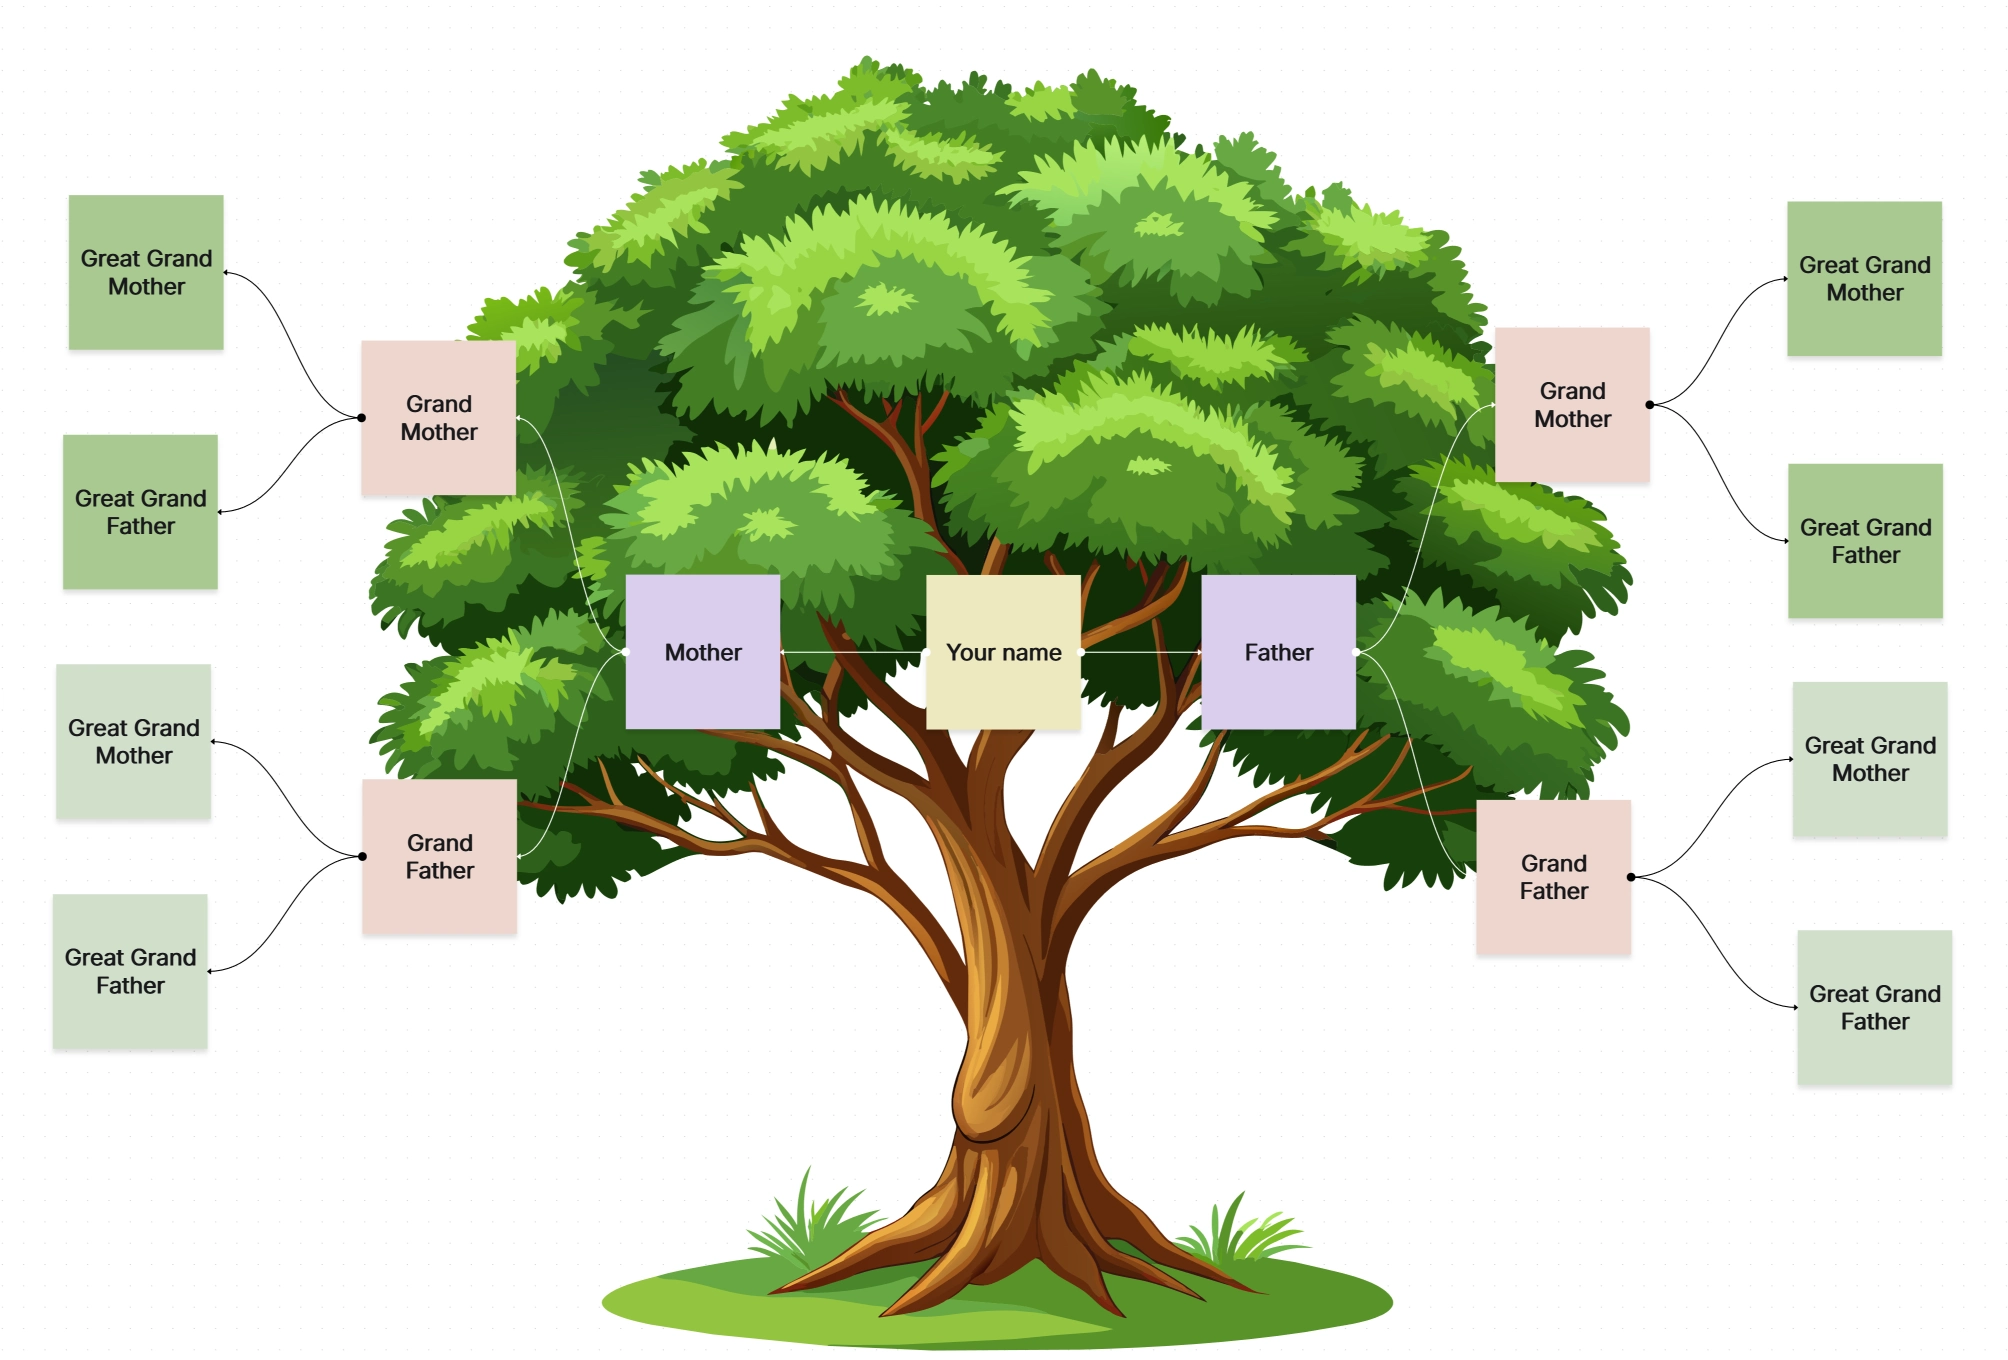
Family tree chart shows family relationships across generations. It visually represents ancestry, lineage, and family connections using a simple tree diagram layout.
A decision tree diagram maps out choices and possible outcomes. It is a popular tree diagram example in business, finance, and data analysis.
.webp)
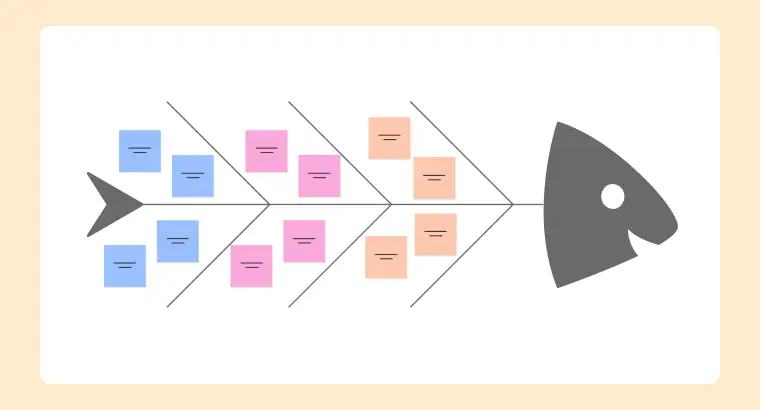
Used in engineering and safety analysis, this branching diagram identifies causes of system failures by tracing problems back to their root.
.webp)
This tree structure diagram displays company roles and reporting relationships. It is often called a tree chart in workplace planning.
.webp)
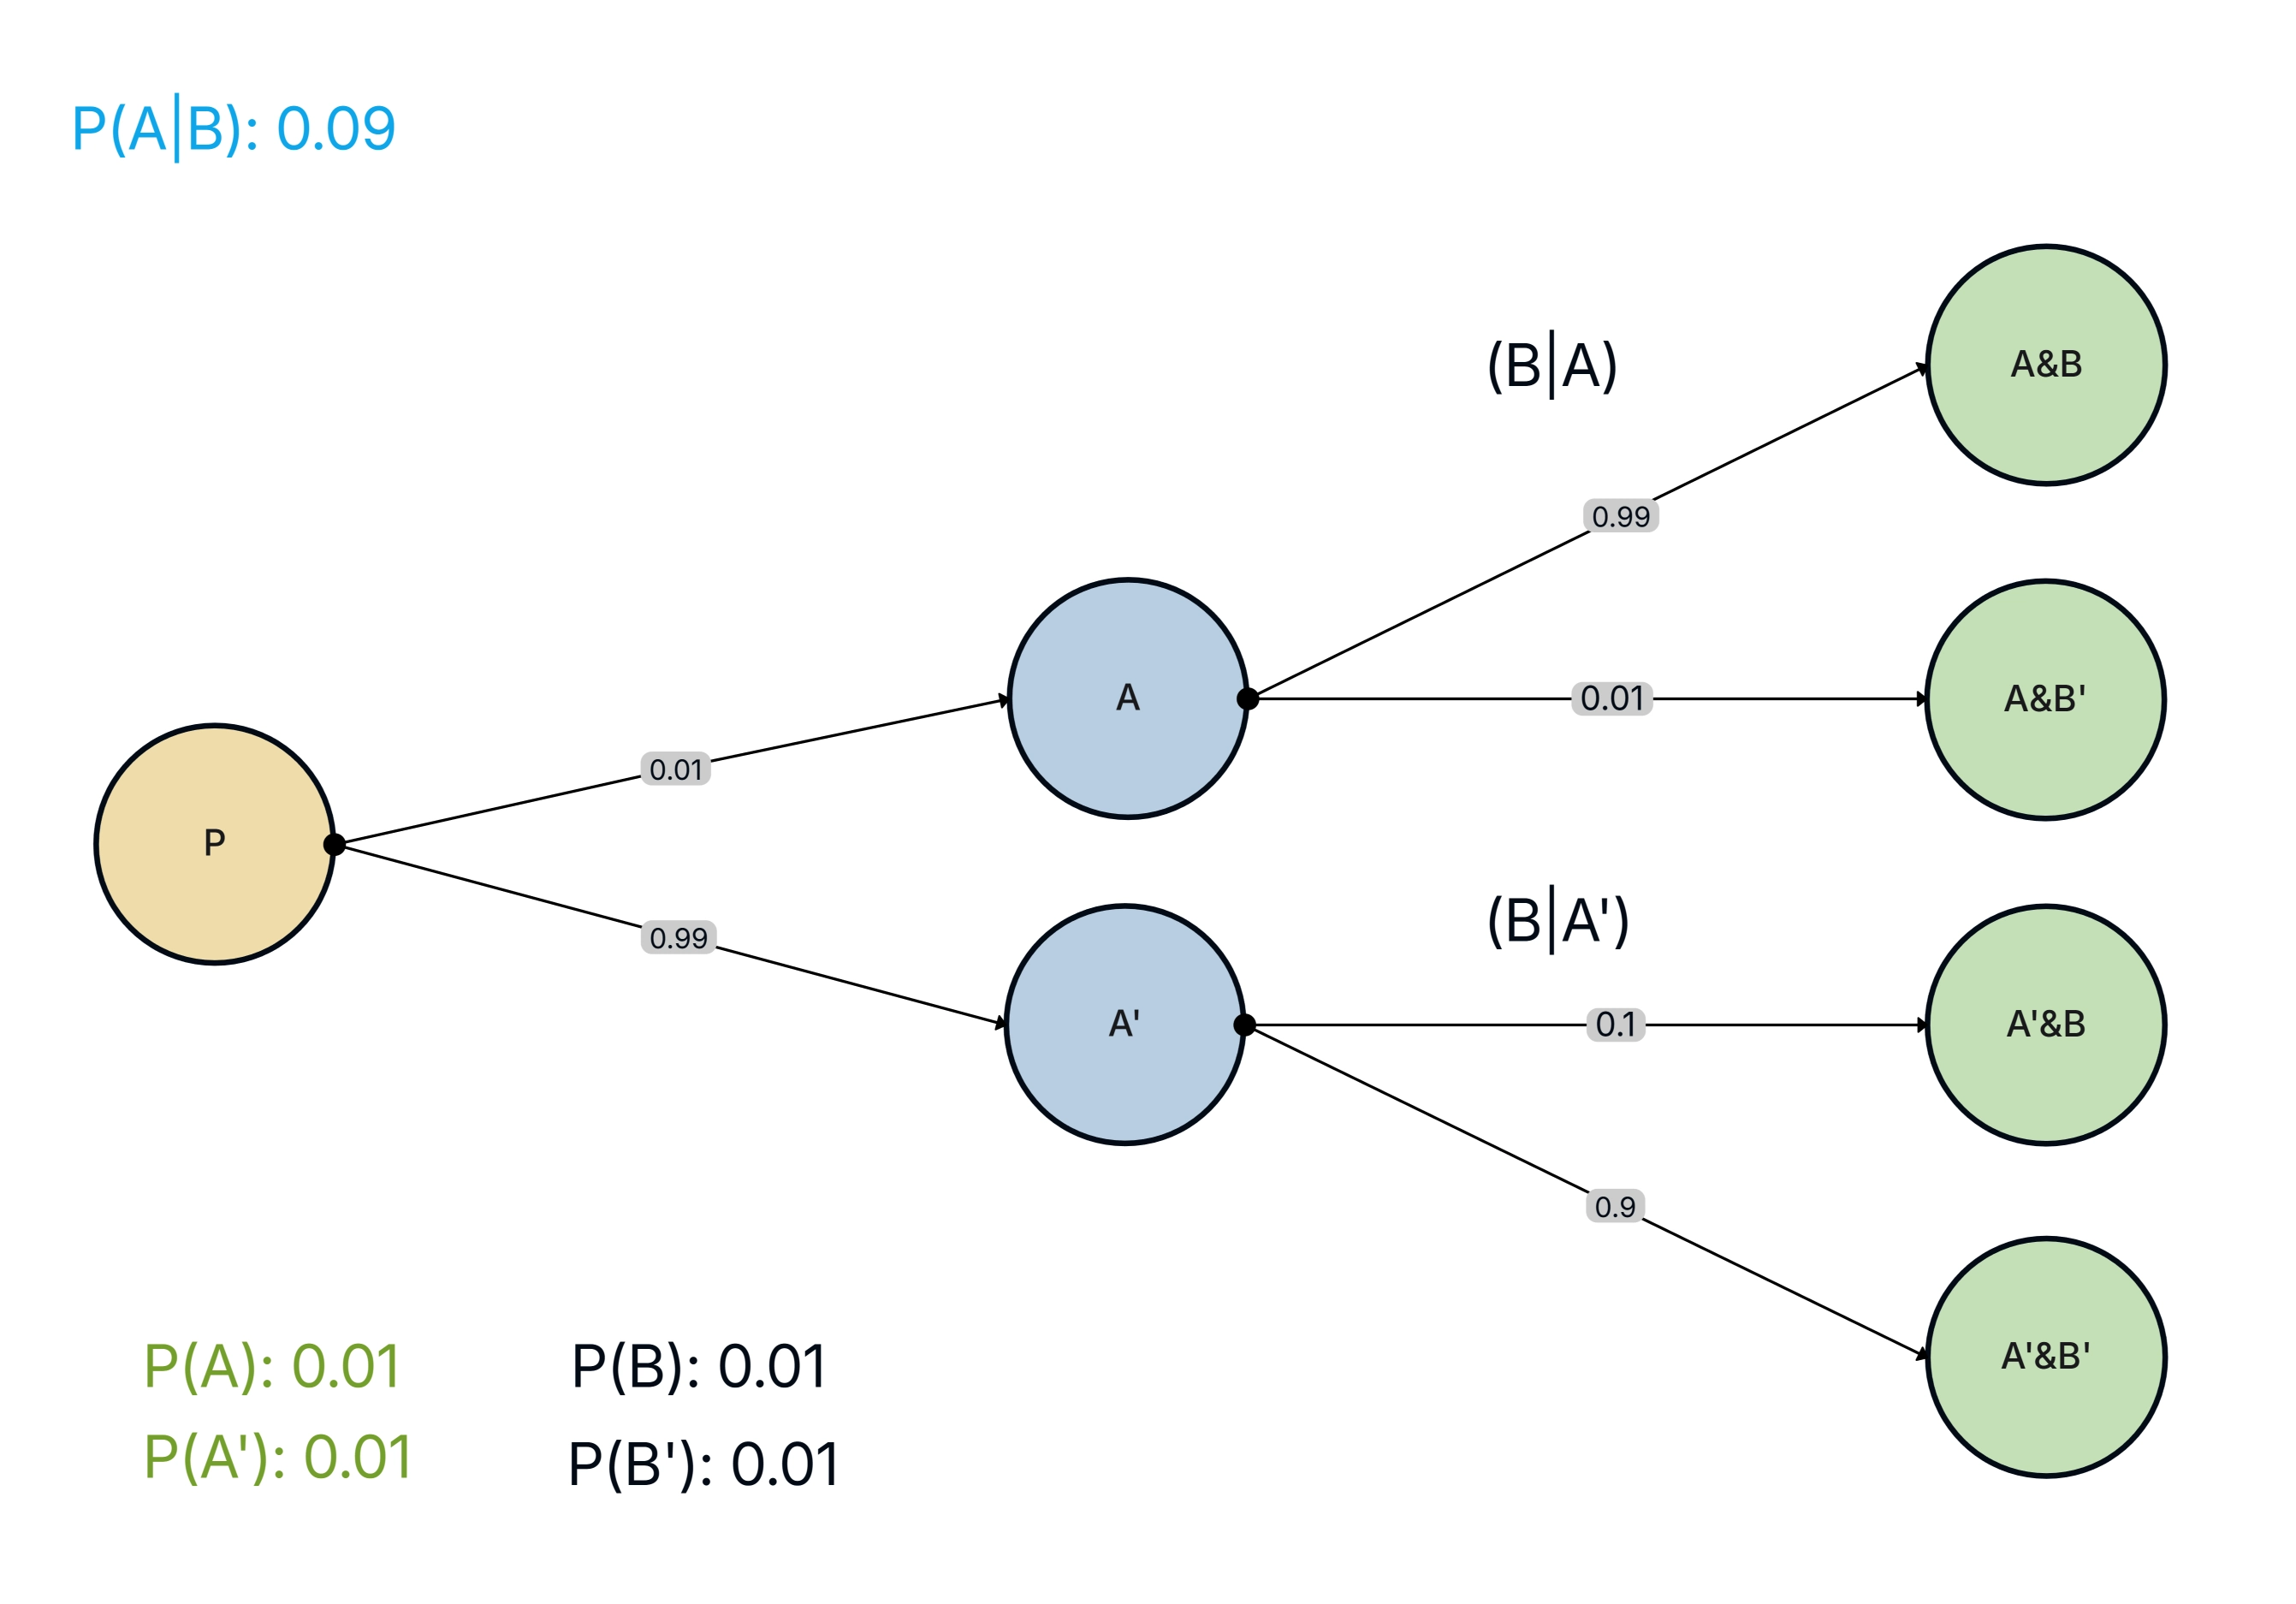
This type shows different possible outcomes along with probabilities. It helps calculate chances and is commonly taught in mathematics.
A concept-based diagram of tree that visually connects ideas. It works as a creative tree flow chart for brainstorming and learning.
.webp)
Used in computer science and linguistics, this diagram tree represents the grammatical structure of sentences or code expressions.
.webp)
This form organizes information into ranked categories. It is commonly used in biology, data management, and classification systems.
.webp)
This tree diagram example shows how folders and files are structured inside a computer system, starting from a main directory.
.webp)
The importance of tree diagram lies in its ability to simplify complex information. A tree diagram helps visualize relationships, track decisions, and present data logically.
It allows users to follow structured paths, understand outcomes, and communicate ideas clearly without long explanations or confusion.
Use tree diagrams when information follows a hierarchy, sequence, or decision-based flow. They are ideal when you need to analyze outcomes, plan processes, explore relationships, or explain structured data visually.
If clarity and organization are important, a tree diagram drawing is the right choice.
Creating a tree diagram becomes simple and efficient when you use a dedicated tool. With Cloudairy’s tree diagram maker, you can visually organize ideas, decisions, and hierarchies without manual effort.
Follow these step-by-step instructions to create a clear, structured, and professional tree diagram.
Step 1: Open Cloudairy’s Tree Diagram Maker
Jump into Cloudairy and pick the tree diagram spot. It pops a fresh play-area just for tree builds.
Step 2: Choose a Tree Diagram Template or Start Blank
Grab a ready tree diagram setup for zippy start, or kick off blank to craft your own tree chart fun.
Step 3: Add the Root Node
Drop in the root node for the big start thought. It sets the base of your tree structure diagram.
Step 4: Create Branches and Nodes
Grow branches from the root and add linked nodes. This makes the branching tree diagram pop with links or picks.
Step 5: Customize the Diagram
Tweak words, shapes, colors, and spots for easy eyes. Cloudairy gives bendy changes for plain or wild tree diagrams.
Step 6: Save, Export, or Share
When done, save your tree diagram, send it as pic or file, or share right away for team play.
Tree diagrams offer structured clarity across many use cases.
Cloudairy provides an intuitive platform designed specifically to draw a tree diagram quickly and accurately. It allows users to create professional tree diagram images, customize layouts, and edit structures with ease.
Cloudairy supports everything from a simple tree diagram to advanced branching tree diagram designs, making diagram creation efficient and flexible.
Using a tree diagram template helps save time and ensures consistency. Editable templates allow users to modify nodes, branches, and labels without starting from scratch. Template make tree diagram drawing faster, cleaner, and suitable for presentations, documentation, or learning material.
Tree diagrams include several core features that improve clarity and usability.
Tree diagrams are widely used in real-world scenarios to simplify structured information.
1. Information Technology and Software Development
In IT, tree diagrams are used to represent file systems, database structures, and program logic. A file directory tree diagram or syntax tree diagram helps developers understand system architecture and data flow.
2. Education and Learning
Teachers use tree diagram examples to explain concepts, relationships, and probability. Students understand lessons faster with visual structures.
3. Problem Solving and Decision Analysis
Tree diagrams are widely used to solve complex problems by breaking them into smaller steps. A decision-based tree diagram helps compare choices, visualize consequences, and select the best possible outcome logically.
4. Science and Research
Researchers use branching diagrams to classify data, represent hypotheses, and document experimental outcomes clearly.
5. Business and Management
Businesses use tree charts for planning, risk analysis, and decision mapping. A tree chart improves clarity during strategy discussions.
What is a tree diagram?
What is tree diagram used for?
What are tree diagrams examples?
How do I draw a tree diagram?
What is the importance of tree diagram?
What is a simple tree diagram?
What are parts of a tree diagram?
Start using Cloudairy to design diagrams, documents, and workflows instantly. Harness AI to brainstorm, plan, and build—all in one platform.
Table of Contents

Introduction
 Manage all your work in one placeCollaborate with your teamUse Cloudairy for FREE—forever