Ishikawa Fishbone Diagram Template

Cloudairy
 Copy link

Get your team started in minutes
Sign up with your work email for seamless collaboration.
Whiteboard
Copy link

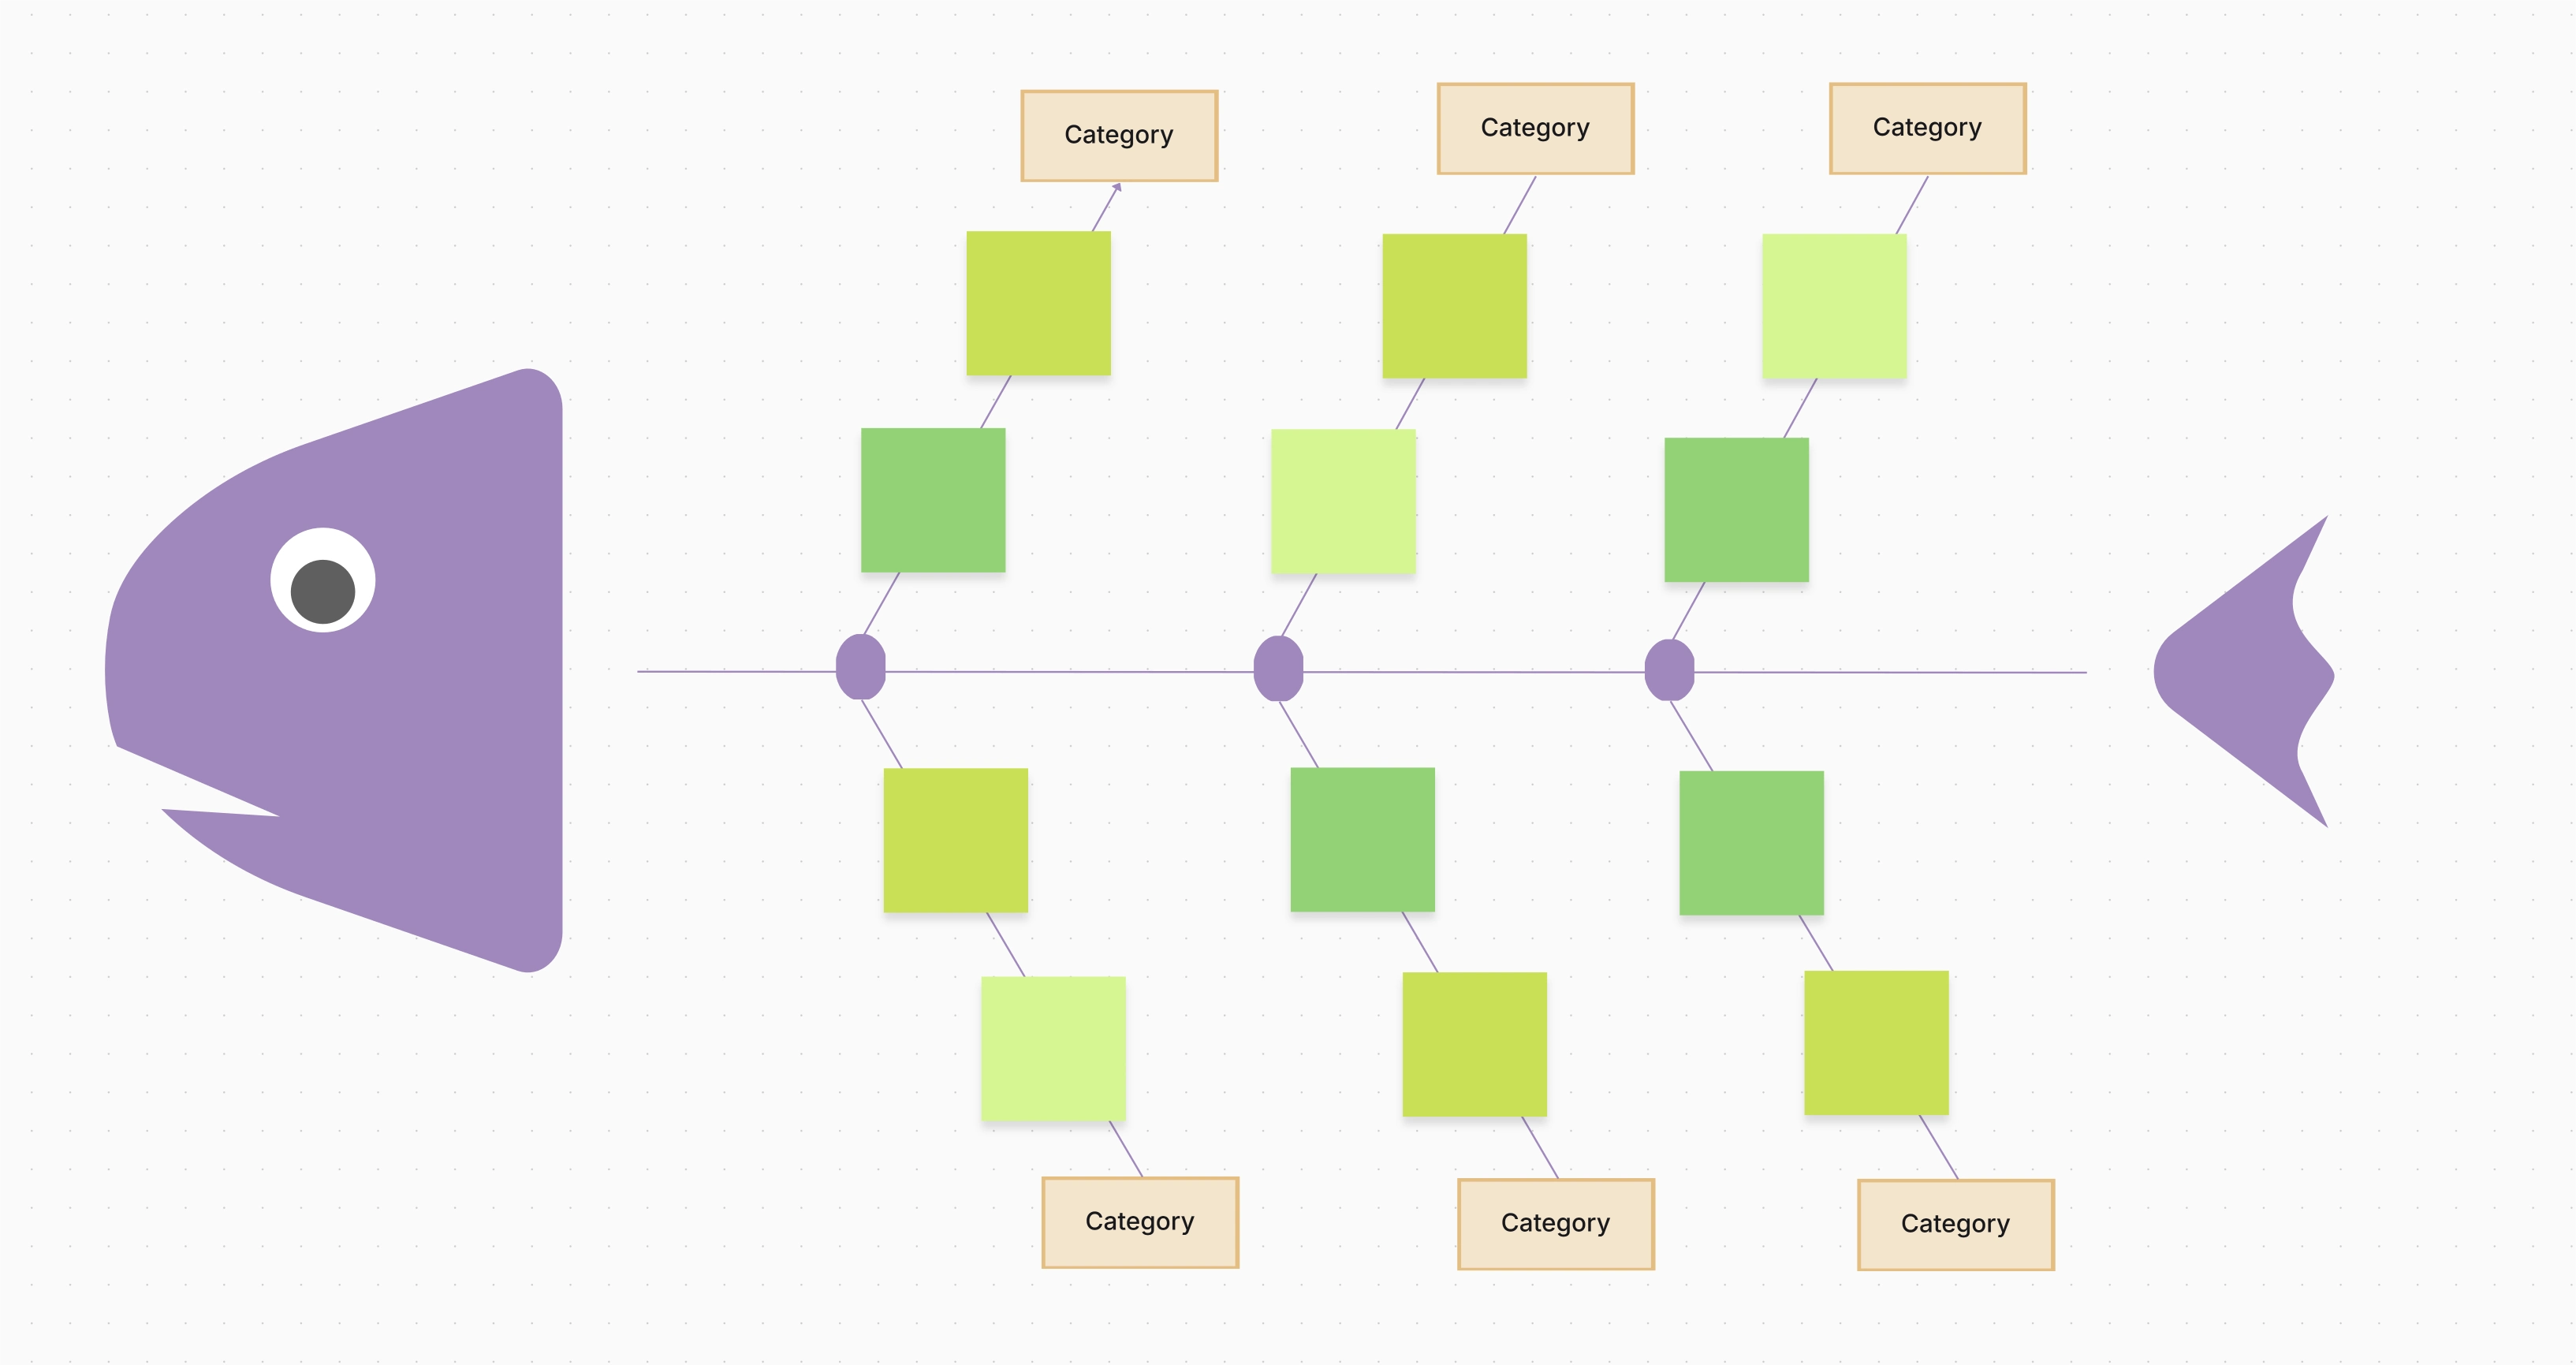
The Ishikawa Fishbone Diagram Template visually maps potential causes of a problem across clearly defined categories in a cause-and-effect structure.
The Ishikawa Fishbone Diagram Template visually maps potential causes of a problem across clearly defined categories in a cause-and-effect structure.
The Ishikawa Fishbone Diagram Template is designed to support structured root cause analysis by visually organizing possible causes of a problem into categorized branches. Also known as a cause-and-effect diagram, it helps teams move beyond symptoms and identify underlying issues through a clear, logical framework.
Loading subcategories...
 Manage all your work in one place
Collaborate with your team
Use Cloudairy for FREE—forever
Explore More