Comparison Chart Maker
AI Comparison Chart Maker
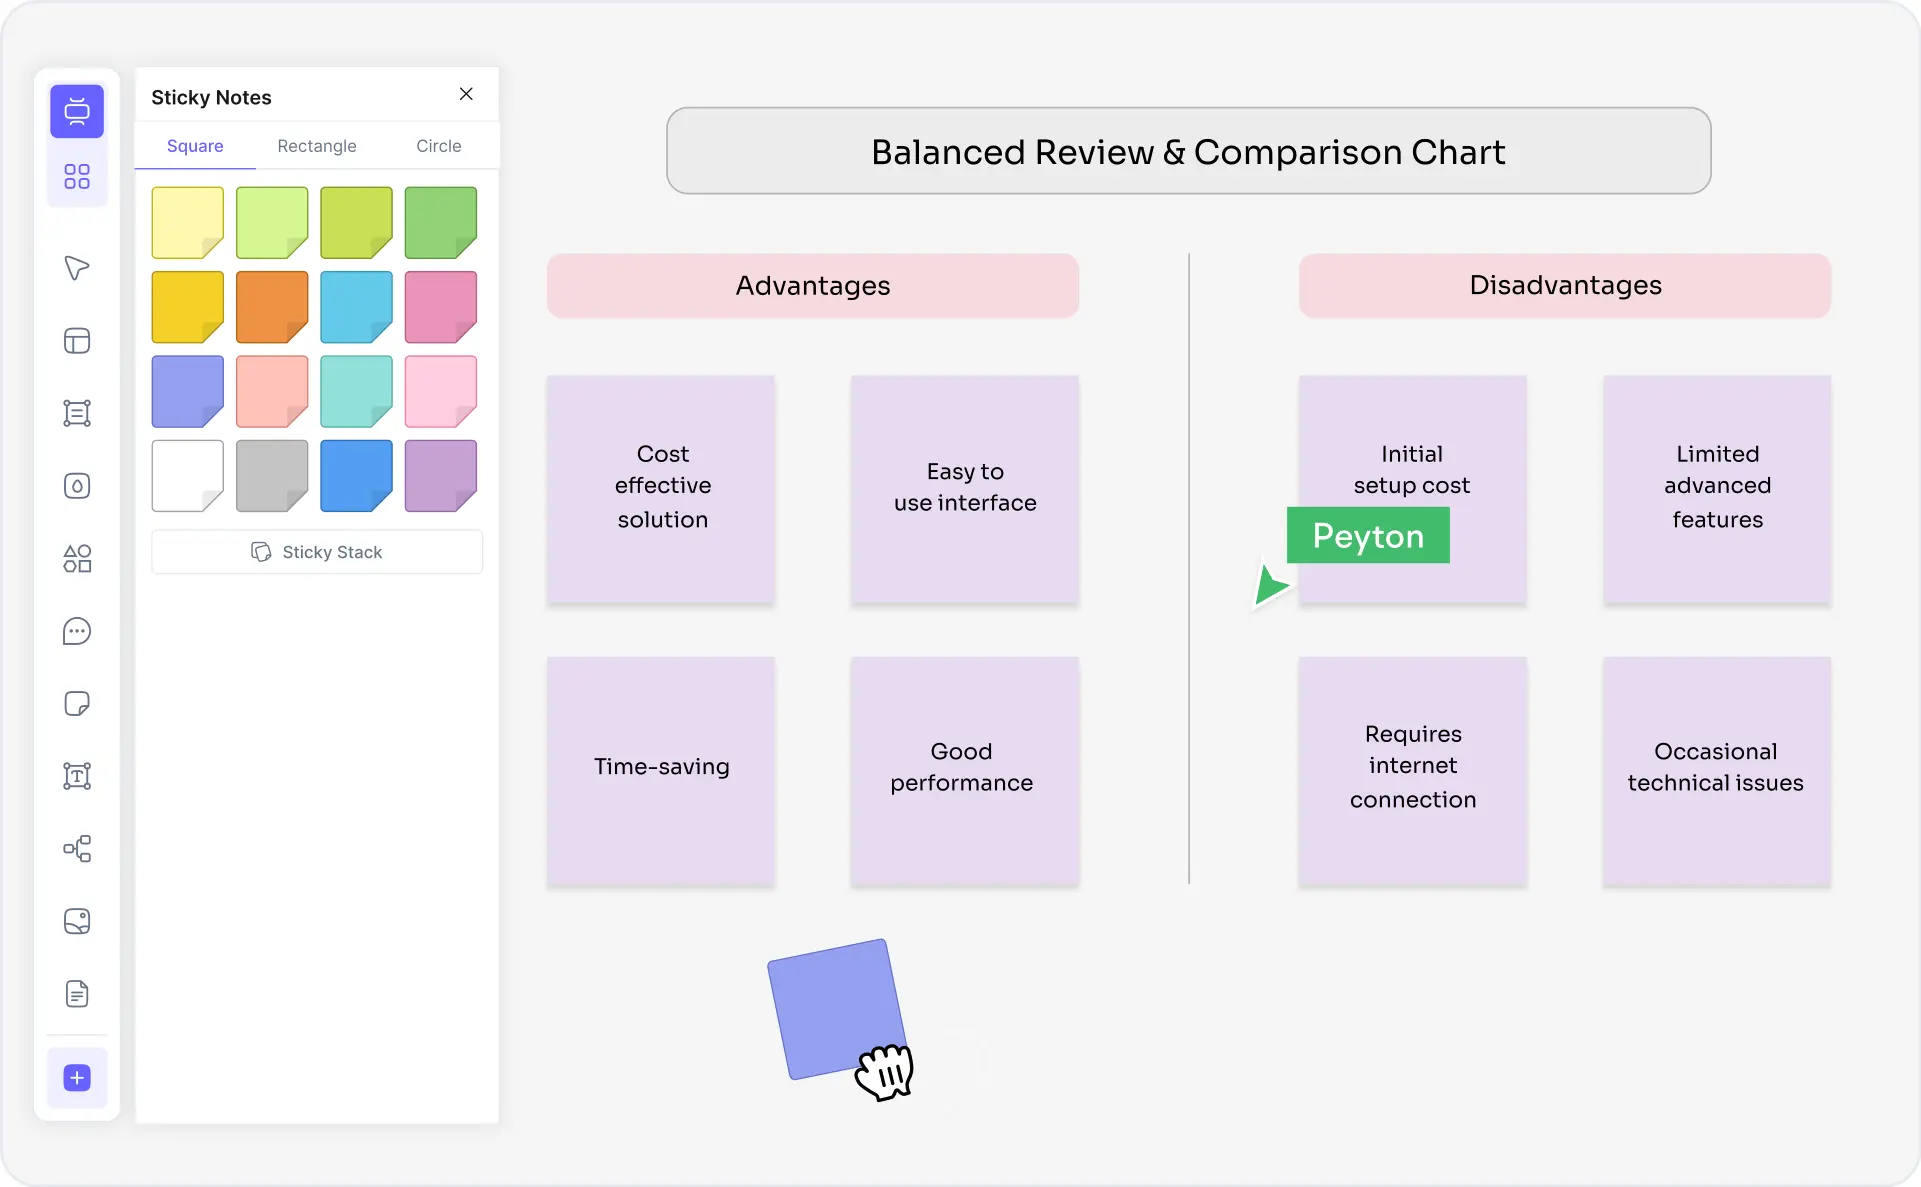
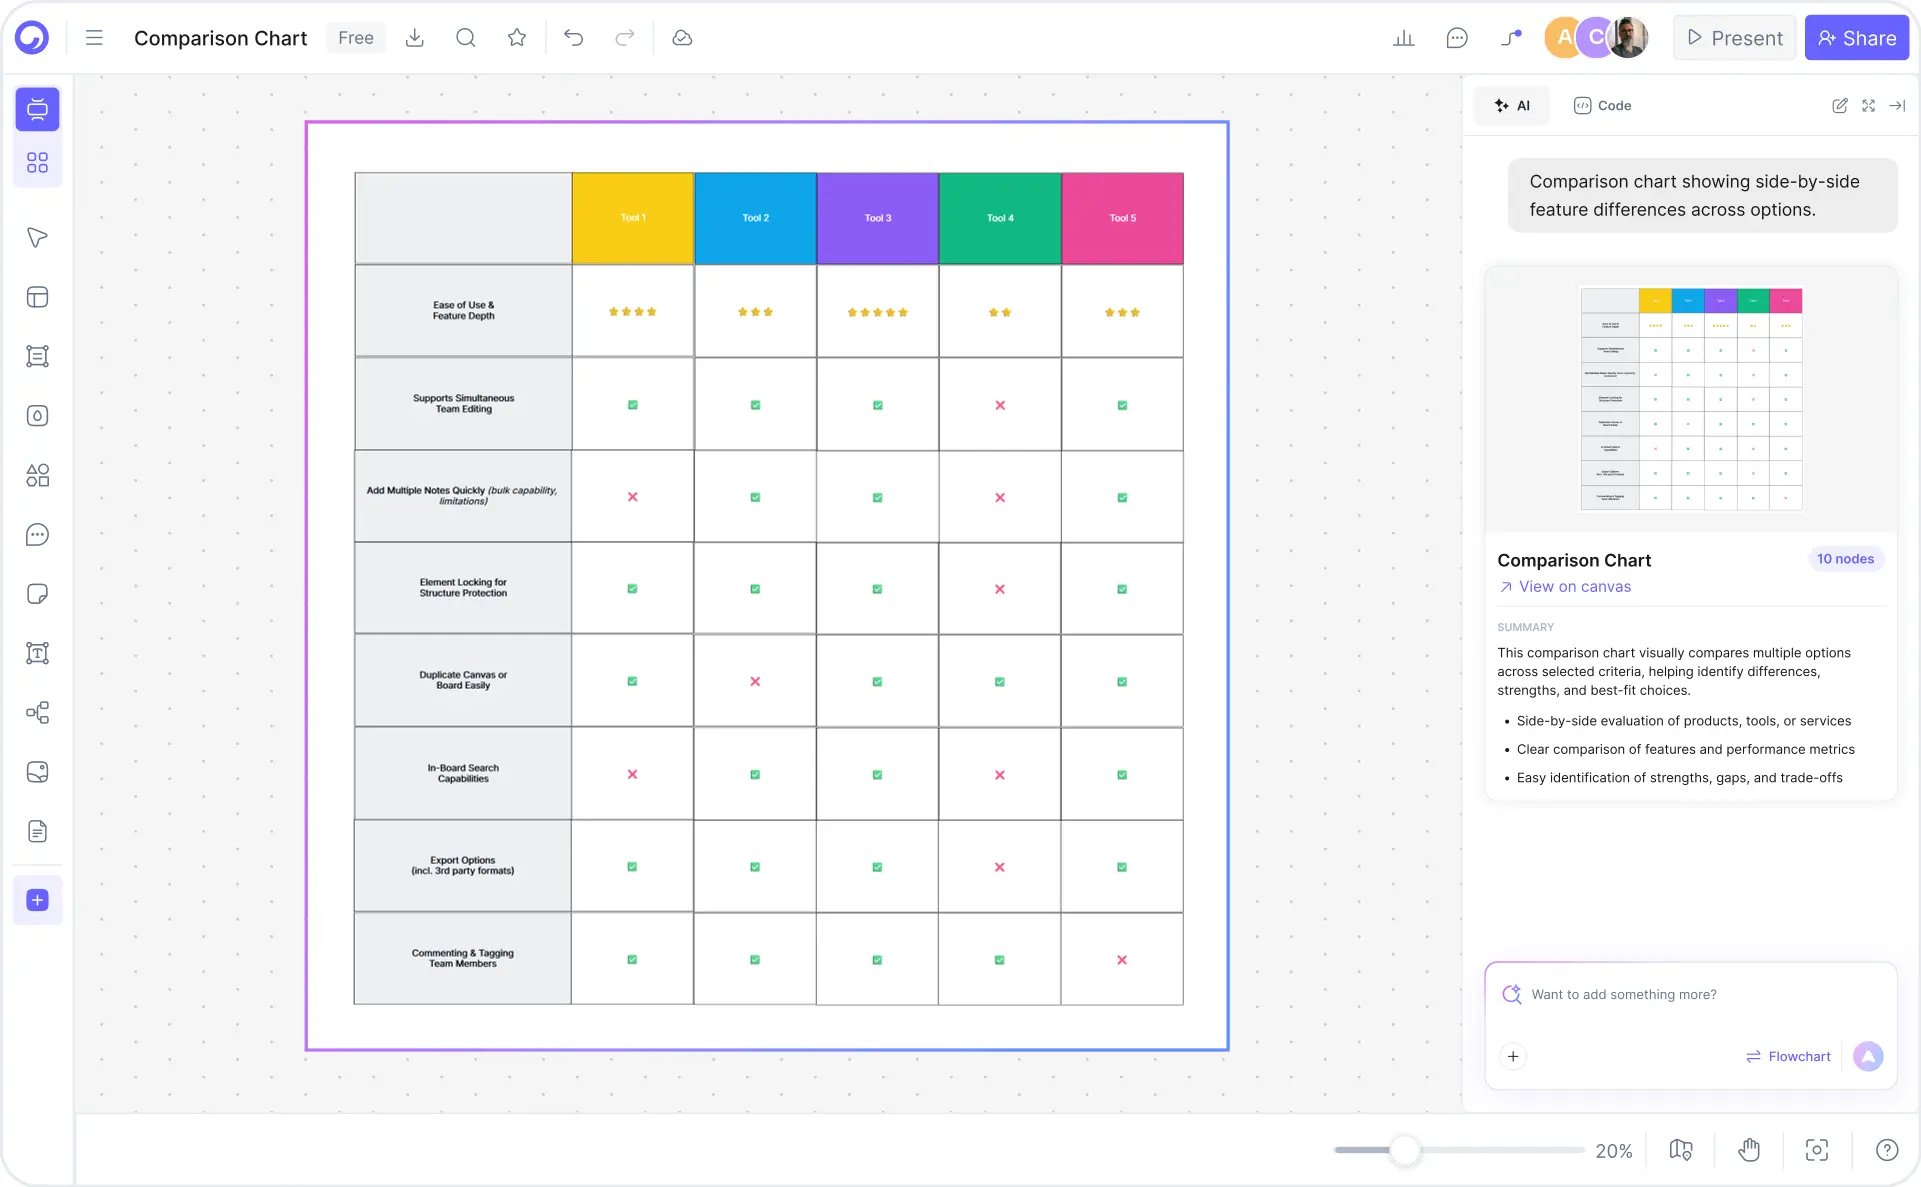
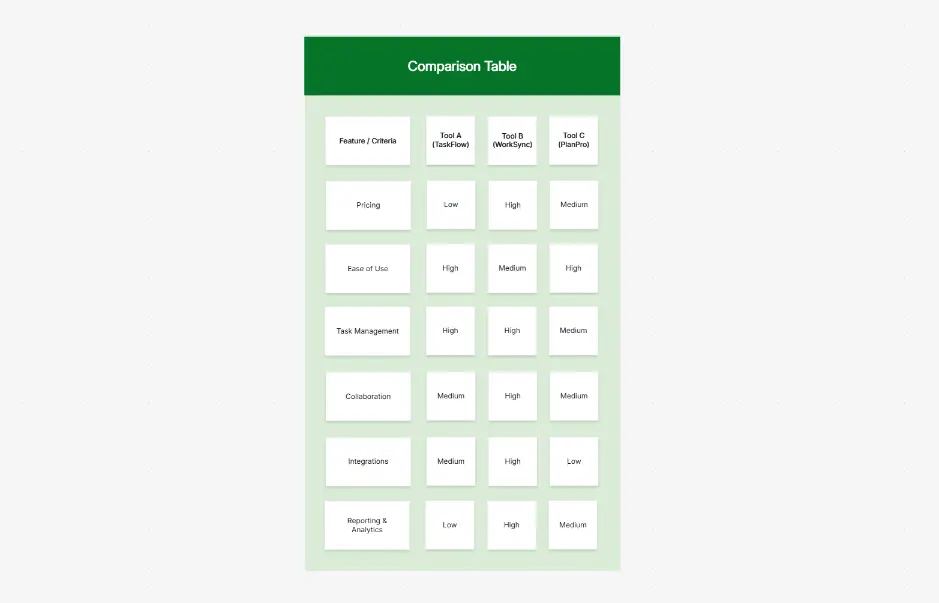
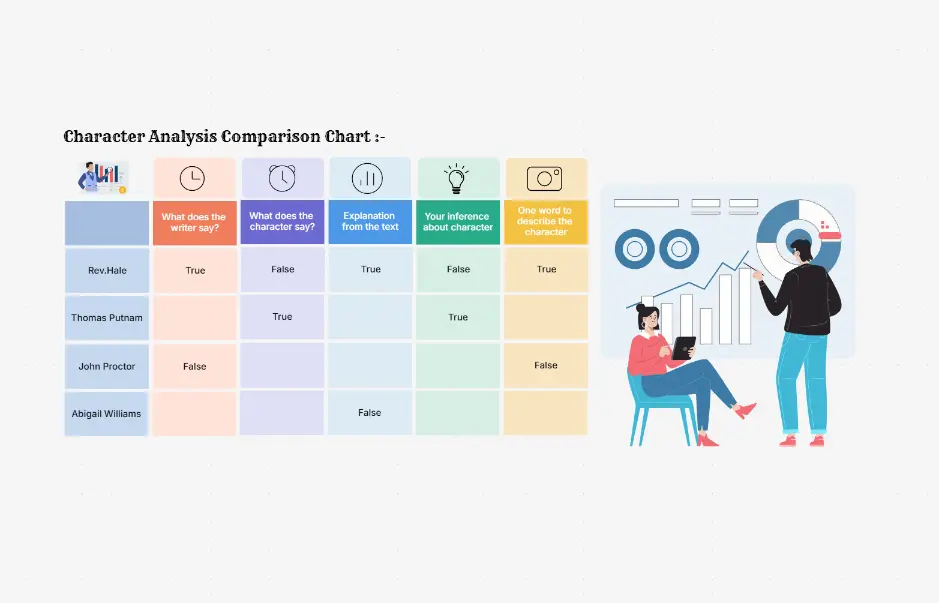
Describe what you want to compare in plain English and Cloudairy's AI instantly generates a professional comparison chart — side-by-side, matrix, feature grid, pros/cons, or radar — in seconds. Export to PNG, SVG, or PDF. No design skills, no manual spreadsheet work required. Free for unlimited charts.
AI prompt-to-chart — describe your products or features in plain English
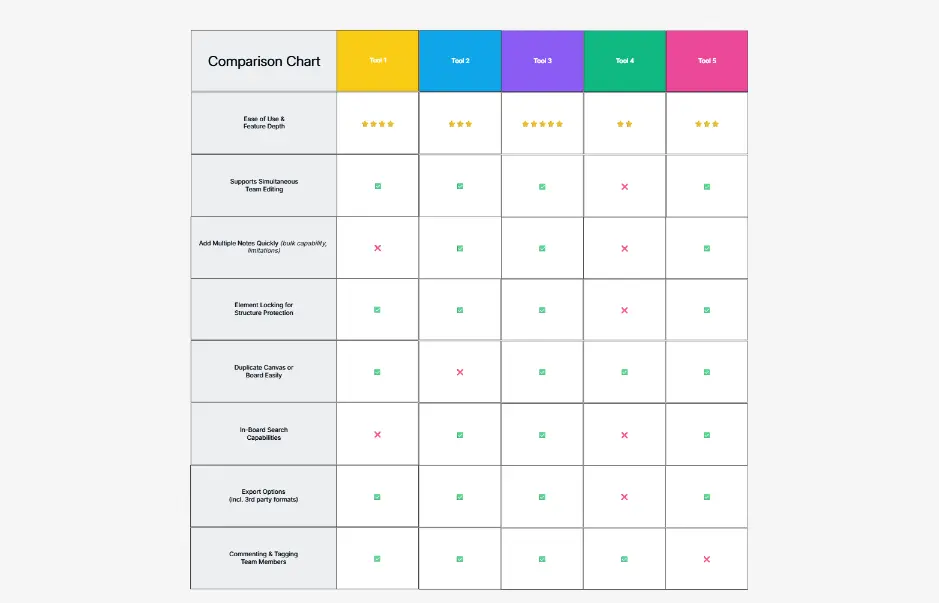
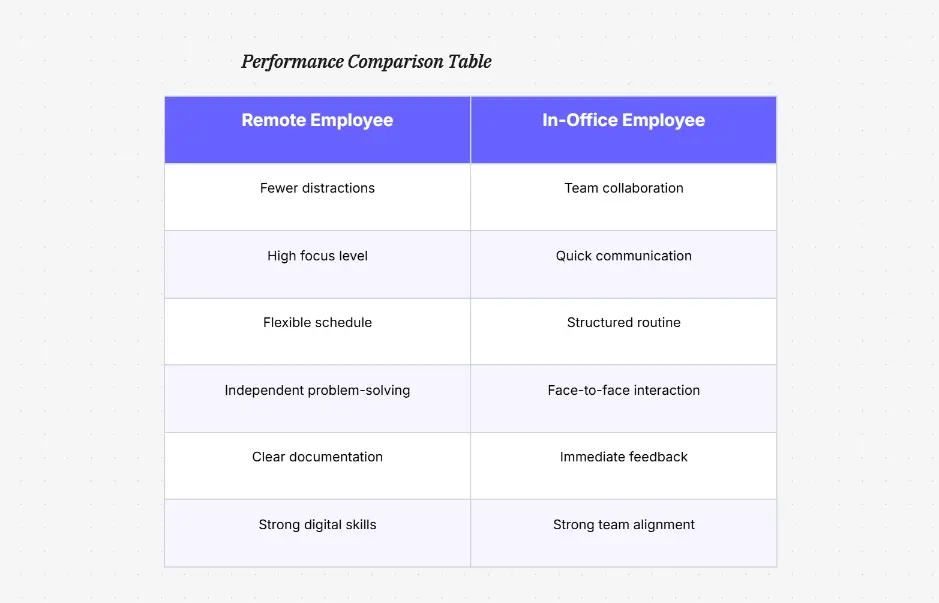
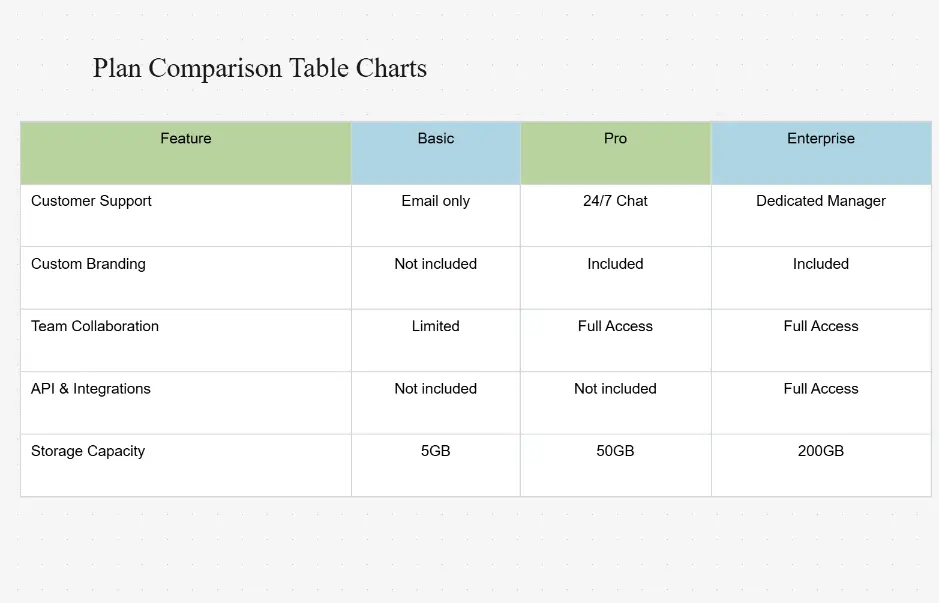
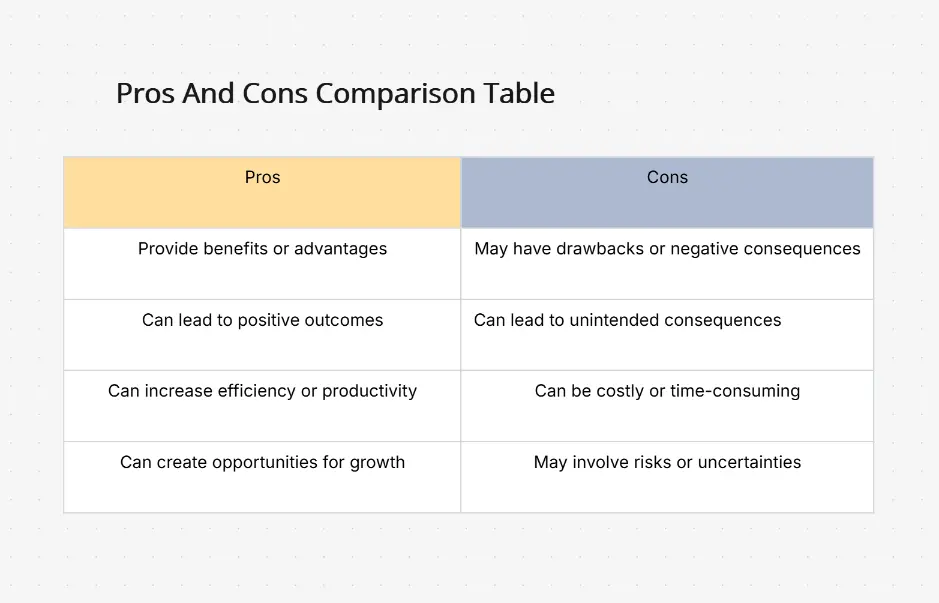
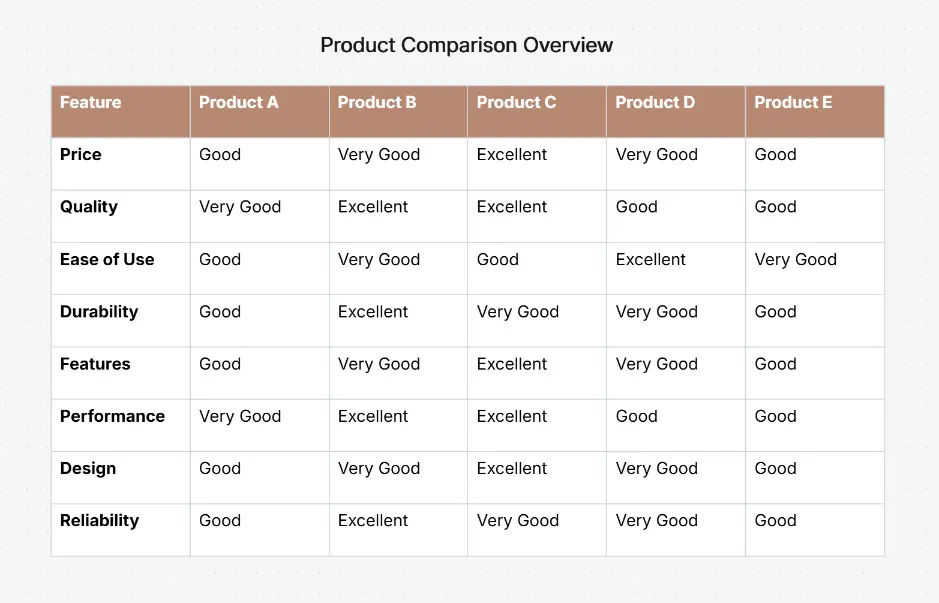
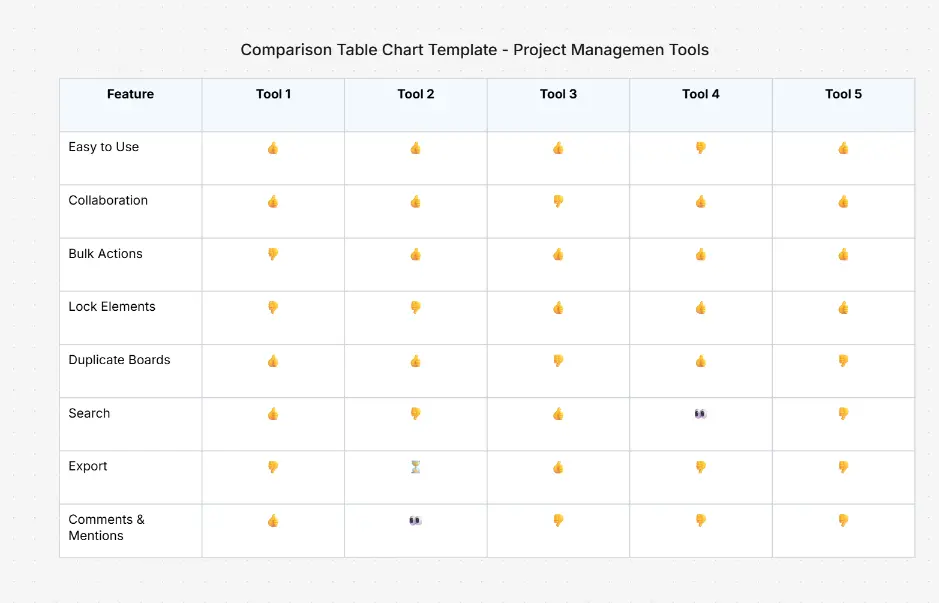
6+ layout types — side-by-side, matrix/grid, feature grid, pros/cons, and radar charts
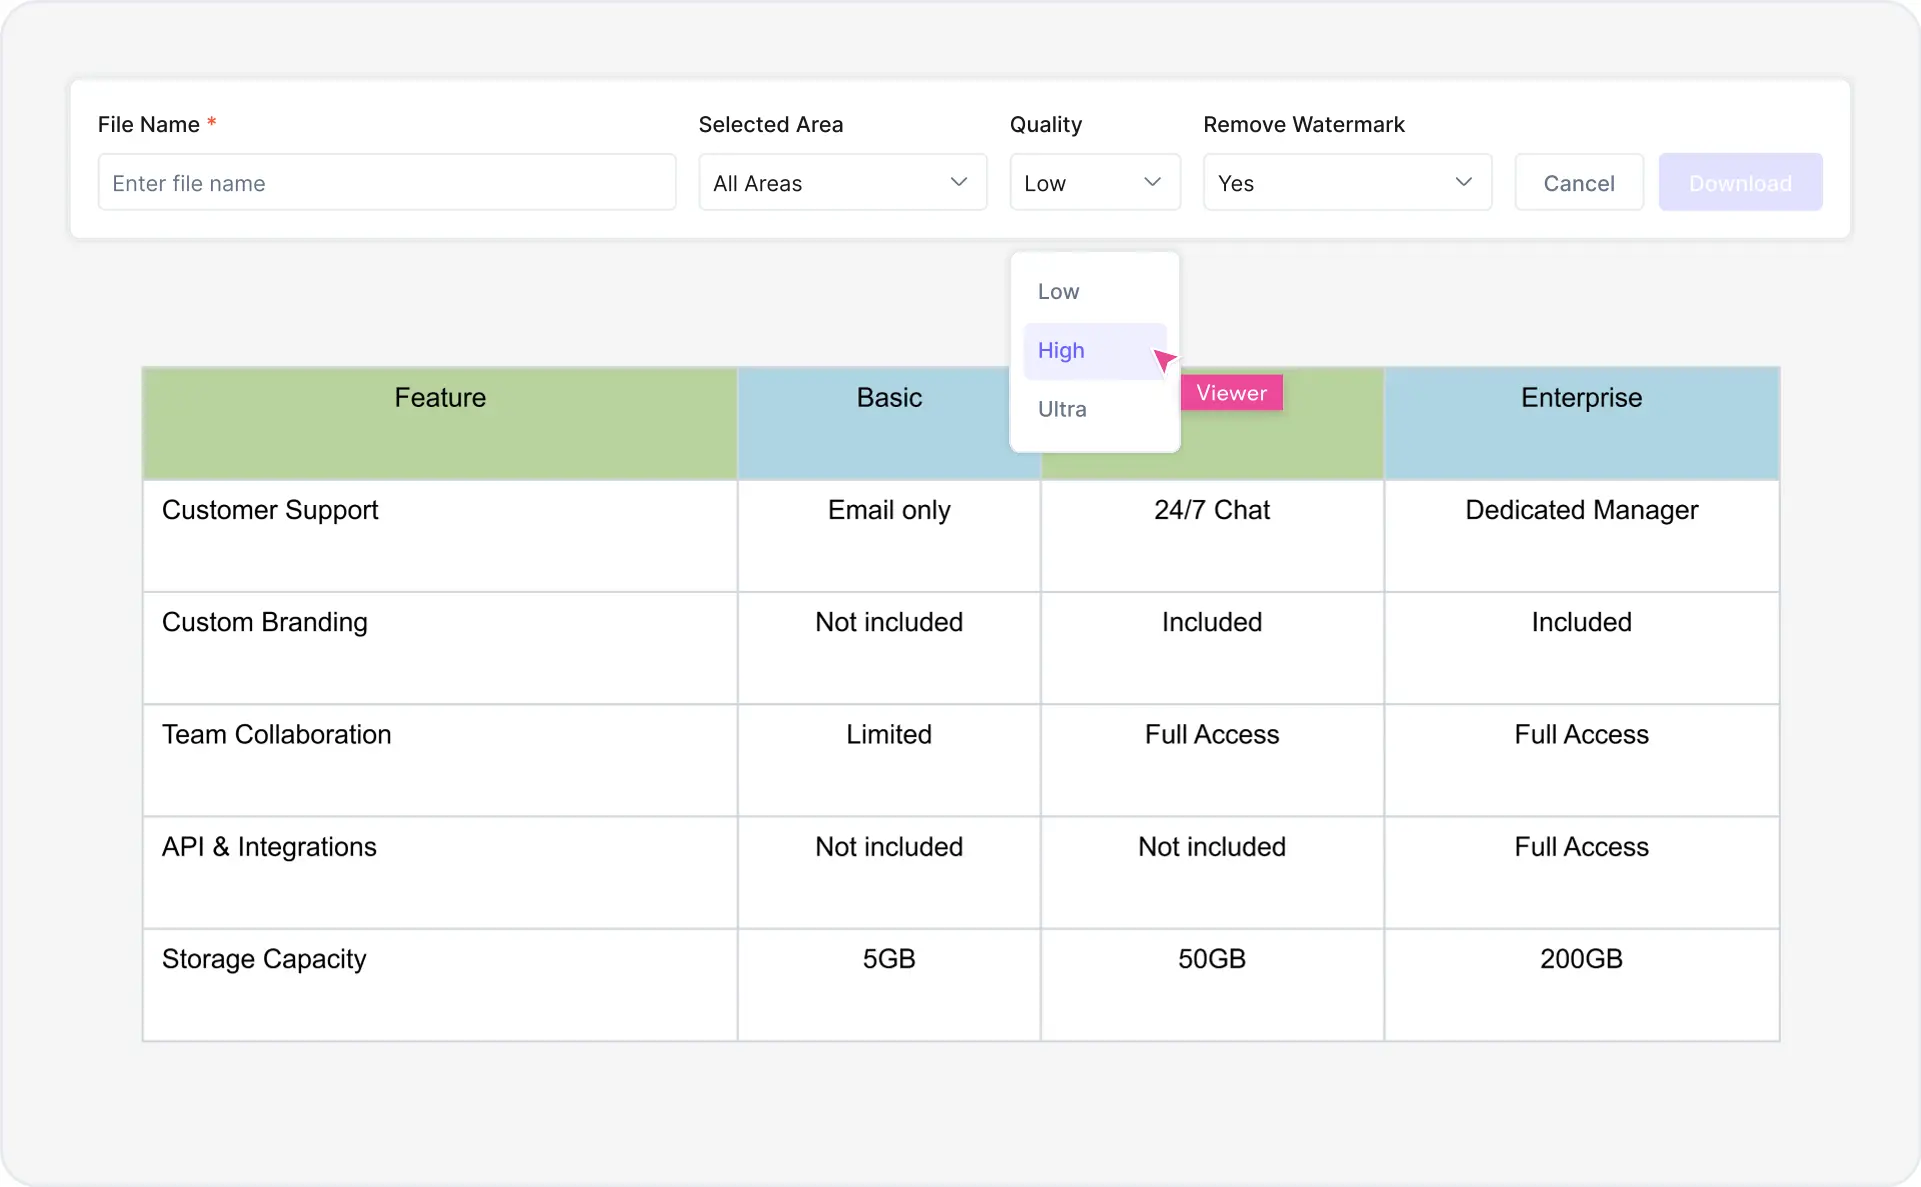
Multi-format export — PNG, SVG, PDF, and PowerPoint — unlimited free tier