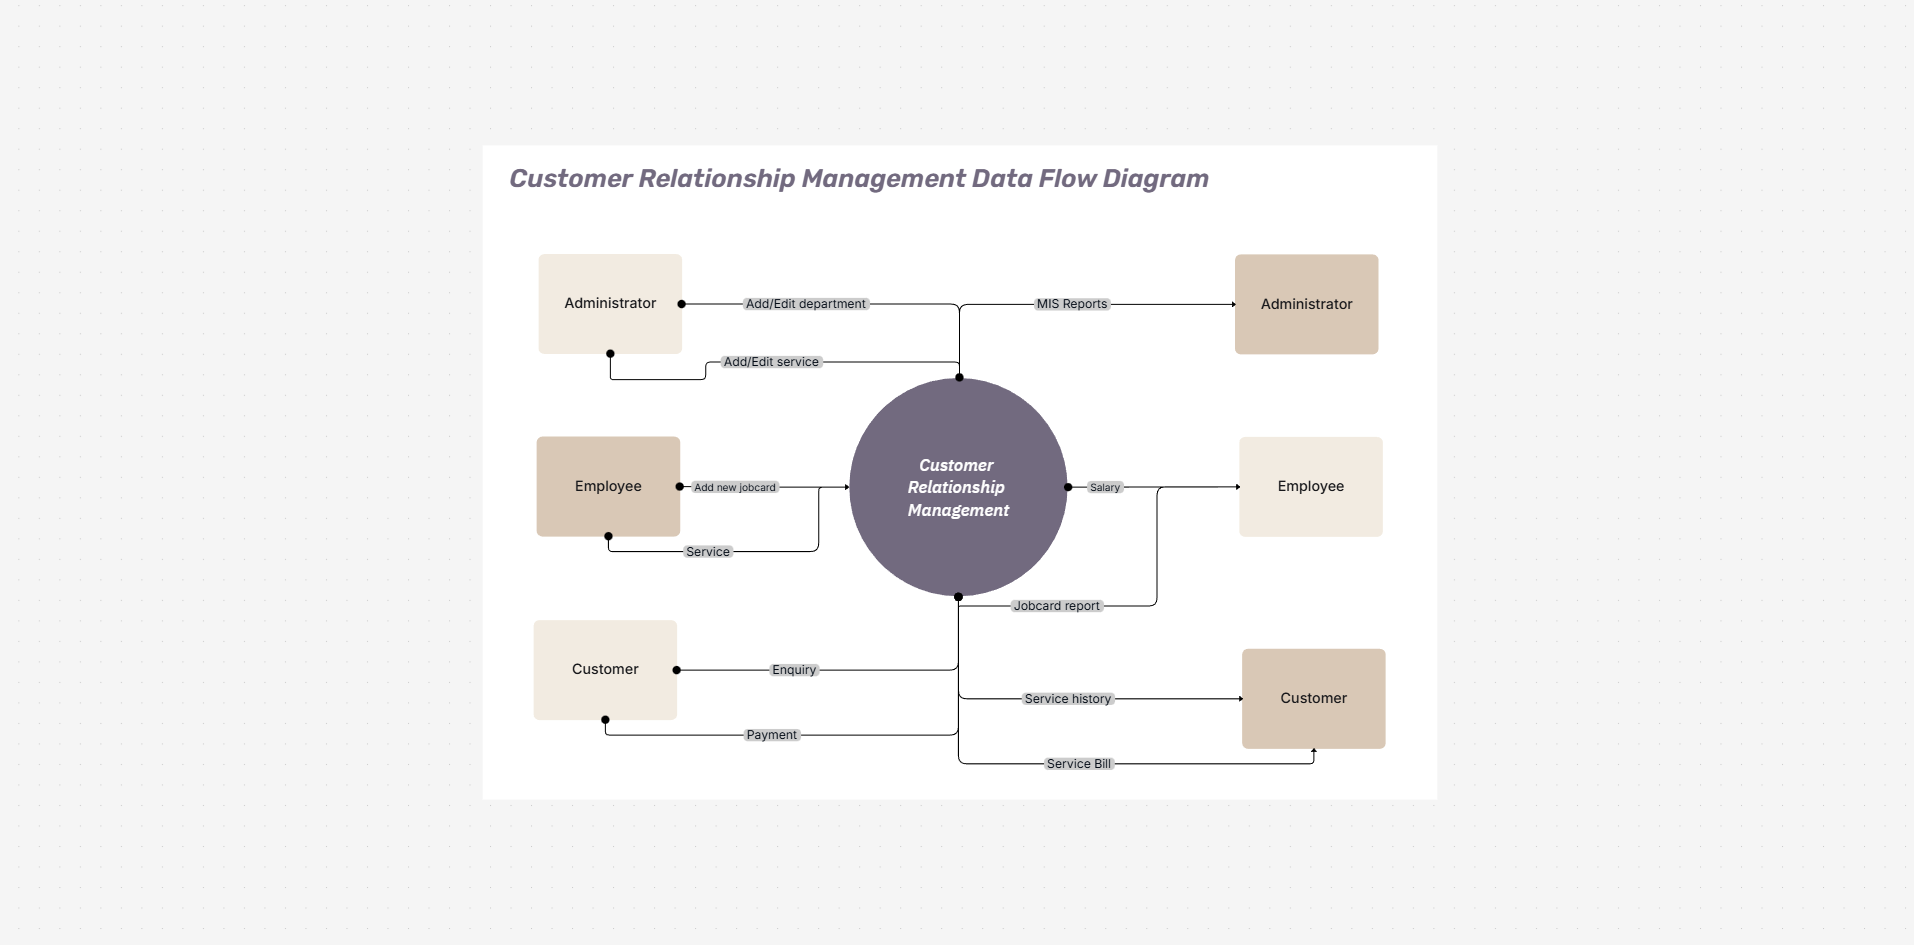
A data flow diagram (DFD) is a visual that shows how data moves through a system — the processes that transform it, the data stores that hold it, and the external entities that send or receive it. Rather than showing control or timing, it maps the flow of information, which makes it ideal for systems analysis, software design, and documenting how a system really works.
With Cloudairy you can build one in minutes: start from a DFD template, add external entities, processes, and data stores, connect them with labelled data flows, then share a live board with your team.
Map data fast with ready-made DFD templates, AI drafting, real-time collaboration, and an infinite canvas built for clear, shareable data flow diagrams.
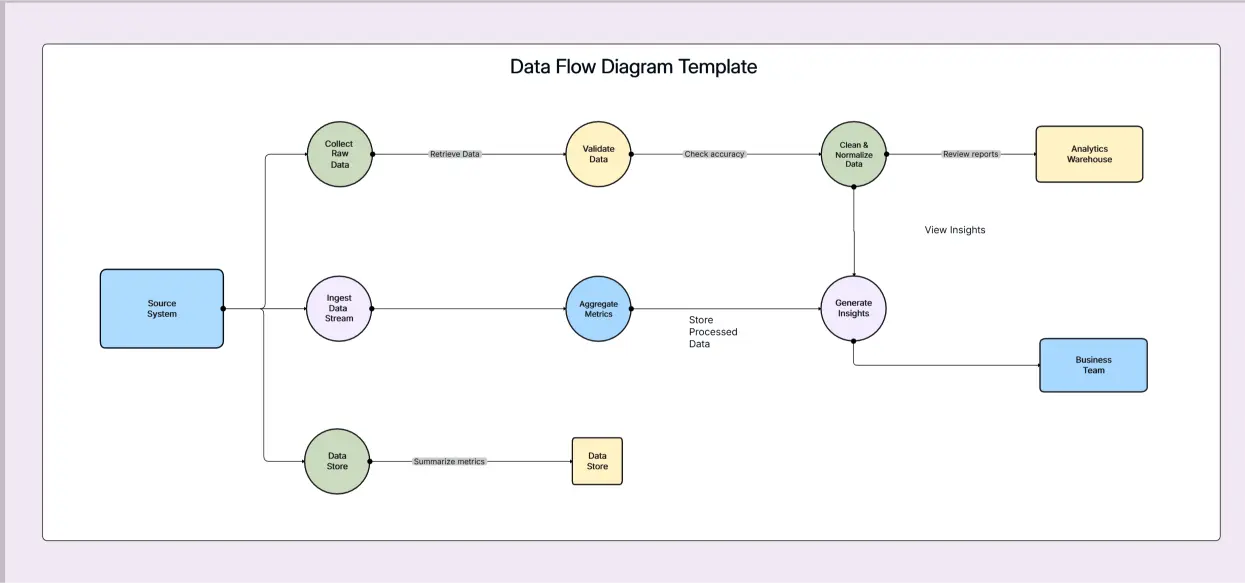
Create a clear data flow diagram in four steps.
Place the external entities — the people or systems that send or receive data — around the edge of the canvas.
Add the processes that transform data and the data stores that hold it, inside the system.
Draw labelled arrows to show each piece of data moving between entities, processes, and stores.
Break the diagram into levels if it grows, then share the live board or export as an image or PDF.
A data flow diagram (DFD) shows how data moves through a system — the processes that transform it, the data stores that hold it, and the external entities that send or receive it. It maps the flow of information rather than control, which makes it a staple of systems analysis and software design.
A DFD uses four elements: external entities (squares) that send or receive data, processes (circles or rounded rectangles) that transform data, data stores (open rectangles) that hold data, and data flows (arrows) that show data moving between them.
A DFD shows how data moves through a system and where it is stored, with no decisions or loops. A flowchart shows the sequence of steps and control logic in a process. DFDs model data; flowcharts model control flow.
DFDs are drawn in levels. The context diagram (level 0) shows the whole system as one process with its external entities. Level 1 breaks that into major sub-processes, and lower levels add more detail as needed.
Start from a DFD template or a blank canvas, add external entities, processes, and data stores, connect them with labelled data flows, split into levels if needed, then share the board with your team.
Yes, you can create data flow diagrams free — no credit card required — with AI drafting, ready-made templates, and real-time collaboration.
Start fast with Cloudairy's ready-made data flow and pipeline templates — DFDs, ETL pipelines, and process flows. Customize any of them in minutes.
Cloudairy makes every kind of diagram — here are a few teams reach for most.
Welcome offer
Get Cloudairy Starter at 60% off — everything, without the cap. Welcome-offer pricing for your first 72 hours.